Narcotics/Drugs Convictions for January 2025
The latest available data from the Justice Department show that during January 2025 the government reported 1423 new narcotics/drugs convictions. According to the case-by-case information analyzed by the Transactional Records Access Clearinghouse (TRAC), this number is up 36.2 percent over the previous month.
The comparisons of the number of defendants convicted for narcotics/drugs-related offenses are based on case-by-case information obtained by TRAC under the Freedom of Information Act from the Executive Office for United States Attorneys (see Table 1).
When monthly 2025 convictions of this type are compared with those of the same period in the previous year, the number of convictions was down (-6.6%). Convictions over the past year are still much lower than they were five years ago. Overall, the data show that convictions of this type are down 16.5 percent from levels reported in 2020.
Figure 1. Monthly Trends in Narcotics/Drugs Convictions
The decrease from the levels five years ago in narcotics/drugs convictions for these matters is shown more clearly in Figure 1. The vertical bars in Figure 1 represent the number of narcotics/drugs convictions of this type recorded on a month-to-month basis. Where a prosecution was initially filed in U.S. Magistrate Court and then transferred to the U.S. District Court, the magistrate filing date was used since this provides an earlier indicator of actual trends. The superimposed line on the bars plots the six-month moving average so that natural fluctuations are smoothed out. The one and five-year rates of change in Table 1 and in the sections that follow are all based upon this six-month moving average. To view trends year-by-year rather than month-by-month, see TRAC's annual report series for a broader picture.
Within the broad category of narcotics/drugs, cases were classified by prosecutors into more specific types.
Case types within narcotics/drugs are
Drug Trafficking
Simple Drug Possession
Organized Crime Drug Enforcement Task Force (OCDETF)
Major Project Triggerlock Prosecutions (OCDETF)
Other Triggerlock Prosecutions (OCDETF)
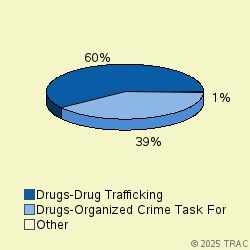
The largest number of convictions of these matters in January 2025 was for "Drugs-Drug Trafficking", accounting for 59.9 percent of convictions. Convictions were also filed for "Drugs-Organized Crime Task Force" (39.5%). See Figure 2.
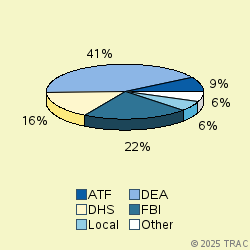
The lead investigative agency for narcotics/drugs convictions in January 2025 was DEA accounting for 41 percent of convictions. Other agencies with substantial numbers of narcotics/drugs convictions were: FBI (22% ), DHS (16%), ATF (9%), Local (6%). See Figure 3.
Narcotics/Drugs Convictions in U.S. Magistrate Courts
Top Ranked Lead Charges
In January 2025, no defendants in narcotics/drugs cases for these matters were convicted in U.S. Magistrate Courts. These courts handle less serious misdemeanor cases, including what are called "petty offenses." In addition, complaints are sometimes filed in the magistrate courts before an indictment or information is entered. In these cases, the matter starts in the magistrate courts and later moves to the district court where subsequent proceedings take place.
Narcotics/Drugs Convictions in U.S. District Courts
In January 2025, 1423 defendants in new cases for these matters were charged in the U.S. District Courts. In addition during January there were an additional 0 defendants whose cases moved from the magistrate courts to the U.S. district courts after an indictment or information was filed. The sections which follow cover both sets of cases and therefore cover all matters filed in district court during January.
Top Ranked Lead Charges
Table 2 shows the top lead charges recorded in the convictions of narcotics/drugs matters filed in U.S. District Court during January 2025.
Lead Charge Count Rank 1yr ago 5yrs ago 21 USC 841 - Drug Abuse Prevention & Control-Prohibited acts A 809 1 1 1 More 21 USC 846 - Attempt and conspiracy 360 2 2 2 More 21 USC 952 - Importation of controlled substances 45 4 3 3 More 18 USC 922 - Firearms; Unlawful acts 38 5 5 4 More 46 USC 70503 - Possession control substance on vessel subject to jurisdiction of US 16 6 6 7 More 18 USC 1956 - Laundering of monetary instruments 12 7 8 9 More 21 USC 963 - Attempt and conspiracy 10 8 9 6 More 18 USC 1343 - Fraud by wire, radio, or television 9 9 28 - More 21 USC 959 - Possession, manufacture, or distribution for purpo 7 10 14 17 More Table 2. Top Charges for Convictions
"Drug Abuse Prevention & Control-Prohibited acts A" (Title 21 U.S.C Section 841) was the most frequent recorded lead charge. "Drug Abuse Prevention & Control-Prohibited acts A" (Title 21 U.S.C Section 841) was ranked 1 a year ago, while it was ranked 1 five years ago.
Ranked 2nd in frequency was the lead charge "Attempt and conspiracy" under Title 21 U.S.C Section 846. "Attempt and conspiracy" under Title 21 U.S.C Section 846 was ranked 2 a year ago, while it was ranked 2 five years ago.
Ranked 3rd was "Other US Code Section" under Title U.S.C Section. "Other US Code Section" under Title U.S.C Section was ranked 4 a year ago, while it was ranked 5 five years ago.
Among these top ten lead charges, the one showing the greatest increase in convictions — up 350 percent — compared to one year ago was Title 18 U.S.C Section 1343 that involves " Fraud by wire, radio, or television ". Compared to five years ago, the largest increase — 145.7 percent — was registered for convictions under "Other US Code Section " (Title U.S.C Section ).
Again among the top ten lead charges, the one showing the sharpest decline in convictions compared to one year ago — down 36.6 percent — was " Laundering of monetary instruments " (Title 18 U.S.C Section 1956 ). Compared to five years ago, the most significant decline in convictions — 50.5 percent — was for convictions where the lead charge was " Importation of controlled substances " (Title 21 U.S.C Section 952 ).
Top Ranked Judicial Districts
In January 2025 the Justice Department's case-by-case records show that the government obtained 509.9 narcotics/drugs convictions for every ten million people in the United States.
Understandably, there is great variation in the per capita number of narcotics/drugs convictions in each of the nation's ninety-four federal judicial districts.
The districts registering the largest number of convictions per capita for these matters last month are shown in Table 3. Districts must have at least 5 narcotics/drugs convictions to receive a ranking.
Judicial District Percapita Count Rank 1yr ago 5yrs ago W Virg, N 2,462 19 1 23 59 More N Dakota 2,449 16 2 15 62 More Vermont 2,409 13 3 86 68 More Okla, E 1,932 12 4 90 87 More W Virg, S 1,848 13 5 63 56 More Mo, E 1,731 42 6 13 16 More Idaho 1,710 28 7 41 48 More Cal, S 1,705 49 8 1 1 More Wyoming 1,644 8 9 74 83 More Penn, W 1,594 49 10 16 42 More Table 3. Top 10 Districts (per ten million people)
The Northern District of West Virginia (Wheeling) — with 2462 convictions as compared with 509.9 convictions per ten million population in the United States — was the most active during January 2025.
The District of North Dakota ranked 2nd.
District of Vermont is now ranking 3rd.
Recent entrants to the top 10 list were Eastern District of Missouri (St. Louis), now ranked 6th , and North Dakota at 2nd In the same order, these districts ranked 13th and 15th one year ago and 16th and 62nd five years ago.
The federal judicial district which showed the greatest growth in the rate of narcotics/drugs convictions compared to one year ago — 147.8 percent — was Vermont . Compared to five years ago, the district with the largest growth — 120.3 percent — was Northern District of West Virginia (Wheeling).
In the last year, the judicial District Court recording the largest drop in the rate of narcotics/drugs convictions — 38.5 percent — was North Dakota . But over the past five years, Southern District of California (San Diego) showed the largest drop — 32 percent.
Top Ranked District Judges
At any one time, there are about 680 federal District Court judges working in the United States. The judges recorded with the largest number of new narcotics/drugs crime cases resulting in convictions of this type during January 2025 are shown in Table 4.
Judge Count Rank 1yr ago 5yrs ago Mazzant, Amos L. Texas, E 23 1 13 82 More O'Connor, Reed Charles Texas, N 20 2 4 47 More Counts, Walter David, III Texas, W 20 2 12 1 More Flanagan, Louise W. N Car, E 17 4 35 37 More Dever, James C., III N Car, E 14 5 73 13 More Stadtmueller, Joseph Peter Wisc, E 14 5 241 650 More Nye, David Charles Idaho 13 7 44 33 More Greer, J. Ronnie Tenn, E 13 7 166 20 More Limbaugh, Stephen Nathaniel, Jr. Mo, E 12 9 90 73 More Horan, Marilyn Jean Penn, W 12 9 438 480 More Table 4. Top Ten Judges
A total of 3 out of the "top ten" judges were in districts which were in the top ten with the largest number of narcotics/drugs convictions per capita, while the remaining 7 judges were from other districts.
Judge Amos L. Mazzant in the Eastern District of Texas (Tyler) ranked 1st with 23 convicted in narcotics/drugs convictions.
Judges Reed Charles O'Connor in the Northern District of Texas (Fort Worth) and Walter David Counts, III in the Western District of Texas (San Antonio) ranked 2nd with 20 convicted in narcotics/drugs convictions. Judge O'Connor also appeared in the top ten rankings one year ago (ranked 4).
Report Generated: March 12, 2025