Convictions for January 2026
Referring Agency: Alcohol, Tobacco, Firearms and Explosives
The latest available data from the Justice Department show that during January 2026 the government reported 568 new convictions for these matters. Those cases were referred by the Alcohol, Tobacco, Firearms and Explosives. According to the case-by-case information analyzed by the Transactional Records Access Clearinghouse (TRAC), this number is up 10.5 percent over the previous month.
The comparisons of the number of defendants convicted are based on case-by-case information obtained by TRAC under the Freedom of Information Act from the Executive Office for United States Attorneys (see Table 1).
When monthly 2026 convictions of this type are compared with those of the same period in the previous year, the number of convictions was only slightly up (1.1%). Convictions over the past year are still much higher than they were five years ago. Overall, the data show that convictions of this type are up 7.6 percent from levels reported in 2021.
Figure 1. Monthly Trends in Convictions
The leveling out from the levels five years ago in convictions for these matters is shown more clearly in Figure 1. The vertical bars in Figure 1 represent the number of convictions of this type recorded on a month-to-month basis. Where a prosecution was initially filed in U.S. Magistrate Court and then transferred to the U.S. District Court, the magistrate filing date was used since this provides an earlier indicator of actual trends. The superimposed line on the bars plots the six-month moving average so that natural fluctuations are smoothed out. The one and five-year rates of change in Table 1 and in the sections that follow are all based upon this six-month moving average. To view trends year-by-year rather than month-by-month, see TRAC's annual report series for a broader picture.
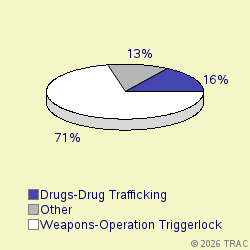
Cases were classified by prosecutors into more specific types.
The largest number of convictions of these matters in January 2026 was for "Weapons-Operation Triggerlock Major", accounting for 71.5 percent of convictions. Convictions were also filed for "Drugs-Drug Trafficking" (16%), "Withheld by Govt from TRAC (FOIA challen" (3.5%), "Drugs-Organized Crime Task Force" (2.8%), "Violence-Other" (2.8%). See Figure 2.
Convictions in U.S. Magistrate Courts
Top Ranked Lead Charges
In January 2026, no defendants in cases for these matters were convicted in U.S. Magistrate Courts. These courts handle less serious misdemeanor cases, including what are called "petty offenses." In addition, complaints are sometimes filed in the magistrate courts before an indictment or information is entered. In these cases, the matter starts in the magistrate courts and later moves to the district court where subsequent proceedings take place.
Convictions in U.S. District Courts
In January 2026, 568 defendants in new cases for these matters were charged in the U.S. District Courts. In addition during January there were an additional 0 defendants whose cases moved from the magistrate courts to the U.S. district courts after an indictment or information was filed. The sections which follow cover both sets of cases and therefore cover all matters filed in district court during January.
Top Ranked Lead Charges
Table 2 shows the top lead charges recorded in the convictions of matters filed in U.S. District Court during January 2026 referred by the Alcohol, Tobacco, Firearms and Explosives.
Lead Charge Count Rank 1yr ago 5yrs ago 18 USC 922 - Firearms; Unlawful acts 370 1 1 1 More 21 USC 841 - Drug Abuse Prevention & Control-Prohibited acts A 59 2 2 2 More 21 USC 846 - Attempt and conspiracy 28 4 3 3 More 18 USC 1951 - Hobbs Act 8 5 5 6 More 18 USC 2119 - Carjacking 7 6 8 9 More 08 USC 1326 - Reentry of deported alien 6 7 - 29 More 18 USC 844 - Explosives - Importation and storage of explosives 5 8 10 10 More 18 USC 924 - Firearms; Penalties 5 8 6 4 More 18 USC 2342 - Trafficking in contraband cigarettes Unlawful acts 5 8 - 18 More Table 2. Top Charges for Convictions
"Firearms; Unlawful acts" (Title 18 U.S.C Section 922) was the most frequent recorded lead charge. "Firearms; Unlawful acts" (Title 18 U.S.C Section 922) was ranked 1 a year ago, while it was ranked 1 five years ago.
Ranked 2nd in frequency was the lead charge "Drug Abuse Prevention & Control-Prohibited acts A" under Title 21 U.S.C Section 841. "Drug Abuse Prevention & Control-Prohibited acts A" under Title 21 U.S.C Section 841 was ranked 2 a year ago, while it was ranked 2 five years ago.
Ranked 3rd was "Other US Code Section" under Title U.S.C Section. "Other US Code Section" under Title U.S.C Section was ranked 4 a year ago, while it was ranked 5 five years ago.
Among these top ten lead charges, the one showing the greatest increase in convictions — up 14.7 percent — compared to one year ago was Title U.S.C Section that involves "Other US Code Section ". Compared to five years ago, the largest increase — 1900 percent — was registered for convictions under " Reentry of deported alien " (Title 8 U.S.C Section 1326 ).
Again among the top ten lead charges, the one showing the sharpest decline in convictions compared to one year ago — down 50 percent — was " Firearms; Penalties " (Title 18 U.S.C Section 924 ). This was the same statute that had the largest decrease — 75 % — when compared with five years ago.
Top Ranked Judicial Districts
In January 2026 the Justice Department's case-by-case records show that the government obtained 200.4 convictions for every ten million people in the United States.
Understandably, there is great variation in the per capita number of convictions in each of the nation's ninety-four federal judicial districts.
The districts registering the largest number of convictions per capita for these matters last month are shown in Table 3. Districts must have at least 5 convictions to receive a ranking.
Judicial District Percapita Count Rank 1yr ago 5yrs ago Montana 1,794 17 1 28 17 More Okla, E 1,439 9 2 58 79 More La, E 1,383 19 3 31 74 More S Dakota 790 6 4 41 45 More N Car, M 712 19 5 13 7 More Ala, S 684 5 6 19 63 More N Car, W 647 19 7 12 20 More W Virg, N 645 5 8 24 52 More Mo, W 543 15 9 27 11 More Ind, N 496 11 10 26 14 More Table 3. Top 10 Districts (per ten million people)
The District of Montana — with 1794 convictions as compared with 200.4 convictions per ten million population in the United States — was the most active during January 2026.
The Eastern District of Oklahoma (Muskogee) ranked 2nd.
Eastern District of Louisiana (New Orleans) is now ranking 3rd.
Recent entrants to the top 10 list were Western District of North Carolina (Asheville), now ranked 7th , and Middle District of North Carolina (Greensboro) at 5th In the same order, these districts ranked 12th and 13th one year ago and 20th and 7th five years ago.
The federal judicial district which showed the greatest growth in the rate of convictions compared to one year ago — 114.3 percent — was Western District of Missouri (Kansas City). Compared to five years ago, the district with the largest growth — 345.5 percent — was Eastern District of Louisiana (New Orleans).
In the last year, the judicial District Court recording the largest drop in the rate of convictions — 45.9 percent — was South Dakota . This was the same district that had the largest increase — 31 percent — when compared with five years ago.
Top Ranked District Judges
At any one time, there are about 680 federal District Court judges working in the United States. The judges recorded with the largest number of new crime cases resulting in convictions of this type during January 2026 are shown in Table 4.
Judge Count Rank Cogburn, Max Oliver, Jr. N Car, W 8 1 More Bell, Kenneth Davis, Sr. N Car, W 8 1 More Pittman, Mark Timothy Texas, N 8 1 More Eagles, Catherine Caldwell N Car, M 7 4 More Osteen, William Lindsay, Jr. N Car, M 6 5 More White, Ronald A. Okla, E 6 5 More Vance, Sarah S. La, E 5 7 More Watters, Susan Pamela Montana 5 7 More O'Connor, Reed Charles Texas, N 5 7 More Maze, Corey Landon Ala, N 4 10 More Brown, Nannette Jolivette La, E 4 10 More Ketchmark, Roseann Ambrosia Mo, W 4 10 More Morris, Brian Matthew Montana 4 10 More Velez-Rive, Camille L. Puer Rico 4 10 More Crone, Marcia A. Texas, E 4 10 More Barker, J. Campbell Texas, E 4 10 More Table 4. Top Ten Judges
A total of 10 out of the "top ten" judges were in districts which were in the top ten with the largest number of convictions per capita, while the remaining 6 judges were from other districts. (Because of ties, there were a total of 16 judges in the "top ten" rankings.)
Judges Max Oliver Cogburn, Jr. in the Western District of North Carolina (Asheville), Kenneth Davis Bell, Sr. in the Western District of North Carolina (Asheville) and Mark Timothy Pittman in the Northern District of Texas (Fort Worth) ranked 1st with 8 convicted in convictions.
Report Generated: April 16, 2026