Prosecutions for March 2026
Referring Agency: Alcohol, Tobacco, Firearms and Explosives
The latest available data from the Justice Department show that during March 2026 the government reported 619 new prosecutions for these matters. Those cases were referred by the Alcohol, Tobacco, Firearms and Explosives. According to the case-by-case information analyzed by the Transactional Records Access Clearinghouse (TRAC), this number is up 11.7 percent over the previous month.
The comparisons of the number of defendants charged are based on case-by-case information obtained by TRAC under the Freedom of Information Act from the Executive Office for United States Attorneys (see Table 1).
When monthly 2026 prosecutions of this type are compared with those of the same period in the previous year, the number of filings was down (-7%). Prosecutions over the past year are still much lower than they were five years ago. Overall, the data show that prosecutions of this type are down 26.7 percent from levels reported in 2021.
Figure 1. Monthly Trends in Prosecutions
The decrease from the levels five years ago in prosecutions for these matters is shown more clearly in Figure 1. The vertical bars in Figure 1 represent the number of prosecutions of this type recorded on a month-to-month basis. Where a prosecution was initially filed in U.S. Magistrate Court and then transferred to the U.S. District Court, the magistrate filing date was used since this provides an earlier indicator of actual trends. The superimposed line on the bars plots the six-month moving average so that natural fluctuations are smoothed out. The one and five-year rates of change in Table 1 and in the sections that follow are all based upon this six-month moving average. To view trends year-by-year rather than month-by-month, see TRAC's annual report series for a broader picture.
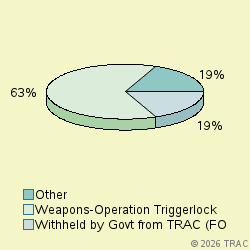
Cases were classified by prosecutors into more specific types.
The largest number of prosecutions of these matters in March 2026 was for "Weapons-Operation Triggerlock Major", accounting for 62.8 percent of prosecutions. Prosecutions were also filed for "Withheld by Govt from TRAC (FOIA challen" (18.6%), "Drugs-Drug Trafficking" (12.8%), "Violence-Other" (3.4%). See Figure 2.
Prosecutions in U.S. Magistrate Courts
Top Ranked Lead Charges
In March 2026, 101 defendants in cases for these matters were filed in U.S. Magistrate Courts. These courts handle less serious misdemeanor cases, including what are called "petty offenses." In addition, complaints are sometimes filed in the magistrate courts before an indictment or information is entered. In these cases, the matter starts in the magistrate courts and later moves to the district court where subsequent proceedings take place.
In the magistrate courts in March the most frequently cited lead charge was Title 18 U.S.C Section 922 involving "Firearms; Unlawful acts". This was the lead charge for 61.4 percent of all magistrate filings in March.
Other frequently prosecuted lead charges include: "21 USC 841 - Drug Abuse Prevention & Control-Prohibited acts A" (8.9%), "21 USC 846 - Attempt and conspiracy" (5.9%).
Prosecutions in U.S. District Courts
In March 2026, 518 defendants in new cases for these matters were charged in the U.S. District Courts. In addition during March there were an additional 101 defendants whose cases moved from the magistrate courts to the U.S. district courts after an indictment or information was filed. The sections which follow cover both sets of cases and therefore cover all matters filed in district court during March.
Top Ranked Lead Charges
Table 2 shows the top lead charges recorded in the prosecutions of matters filed in U.S. District Court during March 2026 referred by the Alcohol, Tobacco, Firearms and Explosives.
Lead Charge Count Rank 1yr ago 5yrs ago 18 USC 922 - Firearms; Unlawful acts 372 1 1 1 More 21 USC 841 - Drug Abuse Prevention & Control-Prohibited acts A 64 2 2 2 More 21 USC 846 - Attempt and conspiracy 18 3 4 3 More 18 USC 924 - Firearms; Penalties 9 4 6 6 More 18 USC 933 - Trafficking in firearms 9 4 - - More 18 USC 1962 - RICO - prohibited activities 8 6 9 11 More 18 USC 1951 - Hobbs Act 7 7 5 4 More 18 USC 844 - Explosives - Importation and storage of explosives 6 8 10 9 More 26 USC 5861 - Tax on Making Firearms - Prohibited acts 6 8 7 8 More 18 USC 1349 - Mail Fraud - Attempt and Conspiracy 3 10 35 23 More Table 2. Top Charges Filed
"Firearms; Unlawful acts" (Title 18 U.S.C Section 922) was the most frequent recorded lead charge. "Firearms; Unlawful acts" (Title 18 U.S.C Section 922) was ranked 1 a year ago, while it was ranked 1 five years ago.
Ranked 2nd in frequency was the lead charge "Drug Abuse Prevention & Control-Prohibited acts A" under Title 21 U.S.C Section 841. "Drug Abuse Prevention & Control-Prohibited acts A" under Title 21 U.S.C Section 841 was ranked 2 a year ago, while it was ranked 2 five years ago.
Ranked 3rd was "Attempt and conspiracy" under Title 21 U.S.C Section 846. "Attempt and conspiracy" under Title 21 U.S.C Section 846 was ranked 4 a year ago, while it was ranked 3 five years ago.
Among these top ten lead charges, the one showing the greatest increase in prosecutions — up 700 percent — compared to one year ago was Title 18 U.S.C Section 1349 that involves " Mail Fraud - Attempt and Conspiracy ". This was the same statute that had the largest increase — 300 % — when compared with five years ago.
Again among the top ten lead charges, the one showing the sharpest decline in prosecutions compared to one year ago — down 40 percent — was " RICO - prohibited activities " (Title 18 U.S.C Section 1962 ). Compared to five years ago, the most significant decline in prosecutions — 47.3 percent — was for filings where the lead charge was " Hobbs Act " (Title 18 U.S.C Section 1951 ).
Top Ranked Judicial Districts
In March 2026 the Justice Department's case-by-case records show that the government brought 218.4 prosecutions for every ten million people in the United States.
Understandably, there is great variation in the per capita number of prosecutions that are filed in each of the nation's ninety-four federal judicial districts.
The districts registering the largest number of prosecutions per capita for these matters last month are shown in Table 3. Districts must have at least 5 prosecutions to receive a ranking.
Judicial District Percapita Count Rank 1yr ago 5yrs ago Montana 1,688 16 1 31 37 More Tenn, W 1,466 19 2 40 20 More Okla, E 1,279 8 3 35 86 More Mo, W 1,122 31 4 8 21 More N Dakota 1,055 7 5 59 65 More S Dakota 1,053 8 6 53 47 More D. C. 1,025 6 7 84 88 More Wyoming 1,021 5 8 81 78 More La, W 862 15 9 49 32 More Ala, M 796 8 10 23 69 More Table 3. Top 10 Districts (per ten million people)
The District of Montana — with 1688 prosecutions as compared with 218.4 prosecutions per ten million population in the United States — was the most active during March 2026.
The Western District of Tennessee (Memphis) ranked 2nd.
Eastern District of Oklahoma (Muskogee) is now ranking 3rd.
Recent entrants to the top 10 list were Middle District of Alabama (Montgomery), now ranked 10th , and Montana at 1st In the same order, these districts ranked 23rd and 31st one year ago and 69th and 37th five years ago.
The federal judicial district which showed the greatest growth in the rate of prosecutions compared to one year ago — 150 percent — was Washington, D.C. (Washington). Compared to five years ago, the district with the largest growth — 366.7 percent — was Eastern District of Oklahoma (Muskogee).
In the last year, the judicial District Court recording the largest drop in the rate of prosecutions — 31.7 percent — was Eastern District of Oklahoma (Muskogee). But over the past five years, South Dakota showed the largest drop — 14.3 percent.
Top Ranked District Judges
At any one time, there are about 680 federal District Court judges working in the United States. The judges recorded with the largest number of new crime cases of this type during March 2026 are shown in Table 4.
Judge Count Rank Beetlestone, Wendy Penn, E 10 1 More Lipman, Sheryl Halle Tenn, W 10 1 More Perez-Montes, Joseph H. L. La, W 6 3 More Epps, Willie J., Jr. Mo, W 6 3 More Welte, Peter David N Dakota 6 3 More O'Connor, Reed Charles Texas, N 6 3 More Rush, David P. Mo, W 5 7 More White, Ronald A. Okla, E 5 7 More Logan, Steven P. Arizona 4 9 More Miller, Brian Stacy Ark, E 4 9 More Becerra, Jacqueline Fla, S 4 9 More Russell, George Levi, III Maryland 4 9 More Bough, Stephen Rogers Mo, W 4 9 More Watters, Susan Pamela Montana 4 9 More Bell, Kenneth Davis, Sr. N Car, W 4 9 More Barrett, Michael Ryan Ohio, S 4 9 More Kazen, John A. Texas, S 4 9 More Garcia, Orlando Luis Texas, W 4 9 More Albright, Alan D Texas, W 4 9 More Table 4. Top Ten Judges
A total of 8 out of the "top ten" judges were in districts which were in the top ten with the largest number of filings per capita, while the remaining 11 judges were from other districts. (Because of ties, there were a total of 19 judges in the "top ten" rankings.)
Judges Wendy Beetlestone in the Eastern District of Pennsylvania (Philadelphia) and Sheryl Halle Lipman in the Western District of Tennessee (Memphis) ranked 1st with 10 defendants in cases.
Judges Joseph H. L. Perez-Montes in the Western District of Louisiana (Shreveport), Willie J. Epps, Jr. in the Western District of Missouri (Kansas City), Peter David Welte in the District of North Dakota and Reed Charles O'Connor in the Northern District of Texas (Fort Worth) ranked 3rd with 6 defendants in cases.
Report Generated: May 21, 2026