Prosecutions for January 2026
Referring Agency: Drug Enforcement Administration
The latest available data from the Justice Department show that during January 2026 the government reported 407 new prosecutions for these matters. Those cases were referred by the Drug Enforcement Administration. According to the case-by-case information analyzed by the Transactional Records Access Clearinghouse (TRAC), this number is down 19.6 percent over the previous month.
The comparisons of the number of defendants charged are based on case-by-case information obtained by TRAC under the Freedom of Information Act from the Executive Office for United States Attorneys (see Table 1).
When monthly 2026 prosecutions of this type are compared with those of the same period in the previous year, the number of filings was down (-4.8%). Prosecutions over the past year are still much lower than they were five years ago. Overall, the data show that prosecutions of this type are down 41.8 percent from levels reported in 2021.
Figure 1. Monthly Trends in Prosecutions
The decrease from the levels five years ago in prosecutions for these matters is shown more clearly in Figure 1. The vertical bars in Figure 1 represent the number of prosecutions of this type recorded on a month-to-month basis. Where a prosecution was initially filed in U.S. Magistrate Court and then transferred to the U.S. District Court, the magistrate filing date was used since this provides an earlier indicator of actual trends. The superimposed line on the bars plots the six-month moving average so that natural fluctuations are smoothed out. The one and five-year rates of change in Table 1 and in the sections that follow are all based upon this six-month moving average. To view trends year-by-year rather than month-by-month, see TRAC's annual report series for a broader picture.
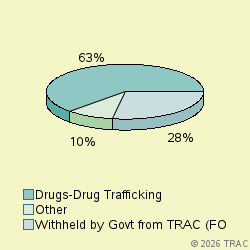
Cases were classified by prosecutors into more specific types.
The largest number of prosecutions of these matters in January 2026 was for "Drugs-Drug Trafficking", accounting for 62.7 percent of prosecutions. Prosecutions were also filed for "Withheld by Govt from TRAC (FOIA challen" (27.5%), "Drugs-Organized Crime Task Force" (4.4%), "Weapons-Operation Triggerlock Major" (3.4%). See Figure 2.
Prosecutions in U.S. Magistrate Courts
Top Ranked Lead Charges
In January 2026, 104 defendants in cases for these matters were filed in U.S. Magistrate Courts. These courts handle less serious misdemeanor cases, including what are called "petty offenses." In addition, complaints are sometimes filed in the magistrate courts before an indictment or information is entered. In these cases, the matter starts in the magistrate courts and later moves to the district court where subsequent proceedings take place.
In the magistrate courts in January the most frequently cited lead charge was Title 21 U.S.C Section 841 involving "Drug Abuse Prevention & Control-Prohibited acts A". This was the lead charge for 59.6 percent of all magistrate filings in January.
Other frequently prosecuted lead charges include: "21 USC 846 - Attempt and conspiracy" (20.2%).
Prosecutions in U.S. District Courts
In January 2026, 303 defendants in new cases for these matters were charged in the U.S. District Courts. In addition during January there were an additional 80 defendants whose cases moved from the magistrate courts to the U.S. district courts after an indictment or information was filed. The sections which follow cover both sets of cases and therefore cover all matters filed in district court during January.
Top Ranked Lead Charges
Table 2 shows the top lead charges recorded in the prosecutions of matters filed in U.S. District Court during January 2026 referred by the Drug Enforcement Administration.
Lead Charge Count Rank 1yr ago 5yrs ago 21 USC 841 - Drug Abuse Prevention & Control-Prohibited acts A 169 1 1 1 More 21 USC 846 - Attempt and conspiracy 55 2 2 2 More 18 USC 922 - Firearms; Unlawful acts 14 3 3 3 More 21 USC 963 - Attempt and conspiracy 8 5 5 10 More 21 USC 848 - Continuing criminal enterprise 4 6 - - More 21 USC 960 - Prohibited acts A 4 6 - - More 21 USC 959 - Possession, manufacture, or distribution for purpo 2 8 8 11 More 18 USC 4 - Misprision of Felony 1 9 19 25 More 18 USC 2119 - Carjacking 1 9 - - More 18 USC 3583 - Term of supervised release after imprisonment 1 9 24 25 More 21 USC 843 - Drug Abuse Prevention & Control-Prohibited acts C 1 9 9 9 More Table 2. Top Charges Filed
"Drug Abuse Prevention & Control-Prohibited acts A" (Title 21 U.S.C Section 841) was the most frequent recorded lead charge. "Drug Abuse Prevention & Control-Prohibited acts A" (Title 21 U.S.C Section 841) was ranked 1 a year ago, while it was ranked 1 five years ago.
Ranked 2nd in frequency was the lead charge "Attempt and conspiracy" under Title 21 U.S.C Section 846. "Attempt and conspiracy" under Title 21 U.S.C Section 846 was ranked 2 a year ago, while it was ranked 2 five years ago.
Ranked 3rd were "Other US Code Section" under Title U.S.C Section and "Firearms; Unlawful acts" under Title 18 U.S.C Section 922. "Other US Code Section" under Title U.S.C Section was ranked 4 a year ago, while it was ranked 4 five years ago."Firearms; Unlawful acts" under Title 18 U.S.C Section 922 was ranked 3 a year ago, while it was ranked 3 five years ago.
Among these top ten lead charges, the one showing the greatest increase in prosecutions — up 100 percent — compared to one year ago was Title 18 U.S.C Section 3583 that involves " Term of supervised release after imprisonment ". Compared to five years ago, the largest increase — 100 percent — was registered for prosecutions under " Attempt and conspiracy " (Title 21 U.S.C Section 963 ).
Again among the top ten lead charges, the one showing the sharpest decline in prosecutions compared to one year ago — down 37.3 percent — was " Firearms; Unlawful acts " (Title 18 U.S.C Section 922 ). This was the same statute that had the largest decrease — 67.7 % — when compared with five years ago.
Top Ranked Judicial Districts
In January 2026 the Justice Department's case-by-case records show that the government brought 135.1 prosecutions for every ten million people in the United States.
Understandably, there is great variation in the per capita number of prosecutions that are filed in each of the nation's ninety-four federal judicial districts.
The districts registering the largest number of prosecutions per capita for these matters last month are shown in Table 3. Districts must have at least 5 prosecutions to receive a ranking.
Judicial District Percapita Count Rank 1yr ago 5yrs ago Alaska 1,184 7 1 88 83 More La, W 805 14 2 46 52 More Mo, E 615 15 3 13 7 More Texas, E 574 22 4 3 4 More Iowa, N 538 6 5 38 51 More Montana 528 5 6 40 73 More Ala, M 498 5 7 45 81 More Fla, N 475 8 8 26 46 More Conn 424 13 9 48 35 More Ken, W 413 8 10 12 84 More Table 3. Top 10 Districts (per ten million people)
The District of Alaska — with 1184 prosecutions as compared with 135.1 prosecutions per ten million population in the United States — was the most active during January 2026.
The Western District of Louisiana (Shreveport) ranked 2nd.
Eastern District of Missouri (St. Louis) is now ranking 3rd.
Recent entrants to the top 10 list were Western District of Kentucky (Louisville), now ranked 10th , and Eastern District of Missouri (St. Louis) at 3rd In the same order, these districts ranked 12th and 13th one year ago and 84th and 7th five years ago.
The federal judicial district which showed the greatest growth in the rate of prosecutions compared to one year ago — 220 percent — was Alaska . Compared to five years ago, the district with the largest growth — 262.5 percent — was Western District of Kentucky (Louisville).
In the last year, the judicial District Court recording the largest drop in the rate of prosecutions — 56.7 percent — was Western District of Kentucky (Louisville). But over the past five years, Connecticut showed the largest drop — 57.1 percent.
Top Ranked District Judges
At any one time, there are about 680 federal District Court judges working in the United States. The judges recorded with the largest number of new crime cases of this type during January 2026 are shown in Table 4.
Judge Count Rank Doughty, Terry Alvin La, W 9 1 More Mazzant, Amos L. Texas, E 9 1 More Gleason, Sharon Louise Alaska 7 3 More Saldana, Diana Texas, S 7 3 More Pepper, Pamela Wisc, E 7 3 More Hale, David Jason Ken, W 6 6 More Kernodle, Jeremy Daniel Texas, E 6 6 More Rodgers, Margaret Catharine Fla, N 5 8 More Williams, Kathleen Mary Fla, S 5 8 More Broomes, John Wesley Kansas 4 10 More Boom, Claria Horn Ken, E 4 10 More Hellerstein, Alvin K. N. Y., S 4 10 More Table 4. Top Ten Judges
A total of 6 out of the "top ten" judges were in districts which were in the top ten with the largest number of filings per capita, while the remaining 6 judges were from other districts. (Because of ties, there were a total of 12 judges in the "top ten" rankings.)
Judges Terry Alvin Doughty in the Western District of Louisiana (Shreveport) and Amos L. Mazzant in the Eastern District of Texas (Tyler) ranked 1st with 9 defendants in cases.
Judges Sharon Louise Gleason in the District of Alaska, Diana Saldana in the Southern District of Texas (Houston) and Pamela Pepper in the Eastern District of Wisconsin (Milwaukee) ranked 3rd with 7 defendants in cases.
Report Generated: April 16, 2026