Convictions for March 2026
Referring Agency: Drug Enforcement Administration
The latest available data from the Justice Department show that during March 2026 the government reported 615 new convictions for these matters. Those cases were referred by the Drug Enforcement Administration. According to the case-by-case information analyzed by the Transactional Records Access Clearinghouse (TRAC), this number is up 23 percent over the previous month.
The comparisons of the number of defendants convicted are based on case-by-case information obtained by TRAC under the Freedom of Information Act from the Executive Office for United States Attorneys (see Table 1).
When monthly 2026 convictions of this type are compared with those of the same period in the previous year, the number of convictions was down (-13.3%). Convictions over the past year are still much lower than they were five years ago. Overall, the data show that convictions of this type are down 11.6 percent from levels reported in 2021.
Figure 1. Monthly Trends in Convictions
The decrease from the levels five years ago in convictions for these matters is shown more clearly in Figure 1. The vertical bars in Figure 1 represent the number of convictions of this type recorded on a month-to-month basis. Where a prosecution was initially filed in U.S. Magistrate Court and then transferred to the U.S. District Court, the magistrate filing date was used since this provides an earlier indicator of actual trends. The superimposed line on the bars plots the six-month moving average so that natural fluctuations are smoothed out. The one and five-year rates of change in Table 1 and in the sections that follow are all based upon this six-month moving average. To view trends year-by-year rather than month-by-month, see TRAC's annual report series for a broader picture.
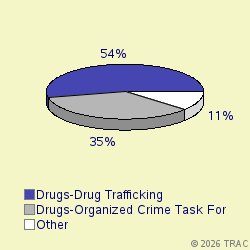
Cases were classified by prosecutors into more specific types.
The largest number of convictions of these matters in March 2026 was for "Drugs-Drug Trafficking", accounting for 53.7 percent of convictions. Convictions were also filed for "Drugs-Organized Crime Task Force" (35%), "Withheld by Govt from TRAC (FOIA challen" (6.5%), "Weapons-Operation Triggerlock Major" (2.6%). See Figure 2.
Convictions in U.S. Magistrate Courts
Top Ranked Lead Charges
In March 2026, no defendants in cases for these matters were convicted in U.S. Magistrate Courts. These courts handle less serious misdemeanor cases, including what are called "petty offenses." In addition, complaints are sometimes filed in the magistrate courts before an indictment or information is entered. In these cases, the matter starts in the magistrate courts and later moves to the district court where subsequent proceedings take place.
Convictions in U.S. District Courts
In March 2026, 613 defendants in new cases for these matters were charged in the U.S. District Courts. In addition during March there were an additional 0 defendants whose cases moved from the magistrate courts to the U.S. district courts after an indictment or information was filed. The sections which follow cover both sets of cases and therefore cover all matters filed in district court during March.
Top Ranked Lead Charges
Table 2 shows the top lead charges recorded in the convictions of matters filed in U.S. District Court during March 2026 referred by the Drug Enforcement Administration.
Lead Charge Count Rank 1yr ago 5yrs ago 21 USC 841 - Drug Abuse Prevention & Control-Prohibited acts A 338 1 1 1 More 21 USC 846 - Attempt and conspiracy 184 2 2 2 More 18 USC 922 - Firearms; Unlawful acts 13 3 4 3 More 21 USC 963 - Attempt and conspiracy 7 4 6 9 More 18 USC 924 - Firearms; Penalties 5 5 20 10 More 21 USC 959 - Possession, manufacture, or distribution for purpo 5 5 8 14 More 21 USC 952 - Importation of controlled substances 4 7 11 5 More 18 USC 1956 - Laundering of monetary instruments 3 8 7 7 More 18 USC 846 - Explosives - Additional powers of the Secretary 2 9 17 13 More 21 USC 843 - Drug Abuse Prevention & Control-Prohibited acts C 2 9 10 8 More 46 USC 70503 - Possession control substance on vessel subject to jurisdiction of US 2 9 9 6 More Table 2. Top Charges for Convictions
"Drug Abuse Prevention & Control-Prohibited acts A" (Title 21 U.S.C Section 841) was the most frequent recorded lead charge. "Drug Abuse Prevention & Control-Prohibited acts A" (Title 21 U.S.C Section 841) was ranked 1 a year ago, while it was ranked 1 five years ago.
Ranked 2nd in frequency was the lead charge "Attempt and conspiracy" under Title 21 U.S.C Section 846. "Attempt and conspiracy" under Title 21 U.S.C Section 846 was ranked 2 a year ago, while it was ranked 2 five years ago.
Ranked 3rd was "Firearms; Unlawful acts" under Title 18 U.S.C Section 922. "Firearms; Unlawful acts" under Title 18 U.S.C Section 922 was ranked 4 a year ago, while it was ranked 3 five years ago.
Among these top ten lead charges, the one showing the greatest increase in convictions — up 950 percent — compared to one year ago was Title 18 U.S.C Section 924 that involves " Firearms; Penalties ". Compared to five years ago, the largest increase — 266.7 percent — was registered for convictions under " Possession, manufacture, or distribution for purpo " (Title 21 U.S.C Section 959 ).
Again among the top ten lead charges, the one showing the sharpest decline in convictions compared to one year ago — down 23.1 percent — was " Importation of controlled substances " (Title 21 U.S.C Section 952 ). This was the same statute that had the largest decrease — 81.8 % — when compared with five years ago.
Top Ranked Judicial Districts
In March 2026 the Justice Department's case-by-case records show that the government obtained 216.3 convictions for every ten million people in the United States.
Understandably, there is great variation in the per capita number of convictions in each of the nation's ninety-four federal judicial districts.
The districts registering the largest number of convictions per capita for these matters last month are shown in Table 3. Districts must have at least 5 convictions to receive a ranking.
Judicial District Percapita Count Rank 1yr ago 5yrs ago Ark, E 1,453 20 1 11 20 More N Dakota 1,356 9 2 38 34 More Ill, S 1,185 12 3 41 24 More W Virg, N 1,160 9 4 41 60 More Ala, S 1,095 8 5 77 56 More S Dakota 1,053 8 6 46 37 More Ark, W 1,003 12 7 53 26 More Ala, M 995 10 8 66 71 More Okla, N 963 9 9 23 74 More Texas, N 744 49 10 1 3 More Table 3. Top 10 Districts (per ten million people)
The Eastern District of Arkansas (Little Rock) — with 1453 convictions as compared with 216.3 convictions per ten million population in the United States — was the most active during March 2026.
The District of North Dakota ranked 2nd.
Southern District of Illinois (East St. Louis) is now ranking 3rd.
Recent entrants to the top 10 list were Eastern District of Arkansas (Little Rock), now ranked 1st , and Northern District of Oklahoma (Tulsa) at 9th In the same order, these districts ranked 11th and 23rd one year ago and 20th and 74th five years ago.
The federal judicial district which showed the greatest growth in the rate of convictions compared to one year ago — 188.9 percent — was Southern District of Alabama (Mobile). Compared to five years ago, the district with the largest growth — 181.8 percent — was Northern District of Oklahoma (Tulsa).
In the last year, the judicial District Court recording the largest drop in the rate of convictions — 38 percent — was Northern District of Oklahoma (Tulsa). But over the past five years, Western District of Arkansas (Fort Smith) showed the largest drop — 41.9 percent.
Top Ranked District Judges
At any one time, there are about 680 federal District Court judges working in the United States. The judges recorded with the largest number of new crime cases resulting in convictions of this type during March 2026 are shown in Table 4.
Judge Count Rank Mazzant, Amos L. Texas, E 16 1 More Counts, Walter David, III Texas, W 11 2 More Miller, Brian Stacy Ark, E 10 3 More Hickey, Susan Owens Ark, W 9 4 More Kinkeade, James E. Texas, N 9 4 More Brown, Ada Elene Texas, N 7 6 More Doughty, Terry Alvin La, W 6 7 More Scholer, Karen Gren Texas, N 6 7 More Hendrix, James Wesley Texas, N 6 7 More Bailey, John Preston W Virg, N 6 7 More Table 4. Top Ten Judges
A total of 7 out of the "top ten" judges were in districts which were in the top ten with the largest number of convictions per capita, while the remaining 3 judges were from other districts.
Judge Amos L. Mazzant in the Eastern District of Texas (Tyler) ranked 1st with 16 convicted in convictions.
Judge Walter David Counts, III in the Western District of Texas (San Antonio) ranked 2nd with 11 convicted in convictions.
Judge Brian Stacy Miller in the Eastern District of Arkansas (Little Rock) ranked 3rd with 10 convicted in convictions.
Report Generated: May 21, 2026