Prosecutions for January 2026
Referring Agency: Federal Bureau of Investigation
The latest available data from the Justice Department show that during January 2026 the government reported 822 new prosecutions for these matters. Those cases were referred by the Federal Bureau of Investigation. According to the case-by-case information analyzed by the Transactional Records Access Clearinghouse (TRAC), this number is down 17.5 percent over the previous month.
The comparisons of the number of defendants charged are based on case-by-case information obtained by TRAC under the Freedom of Information Act from the Executive Office for United States Attorneys (see Table 1).
When monthly 2026 prosecutions of this type are compared with those of the same period in the previous year, the number of filings was up (4%). Prosecutions over the past year are still much lower than they were five years ago. Overall, the data show that prosecutions of this type are down 8.8 percent from levels reported in 2021.
Figure 1. Monthly Trends in Prosecutions
The decrease from the levels five years ago in prosecutions for these matters is shown more clearly in Figure 1. The vertical bars in Figure 1 represent the number of prosecutions of this type recorded on a month-to-month basis. Where a prosecution was initially filed in U.S. Magistrate Court and then transferred to the U.S. District Court, the magistrate filing date was used since this provides an earlier indicator of actual trends. The superimposed line on the bars plots the six-month moving average so that natural fluctuations are smoothed out. The one and five-year rates of change in Table 1 and in the sections that follow are all based upon this six-month moving average. To view trends year-by-year rather than month-by-month, see TRAC's annual report series for a broader picture.
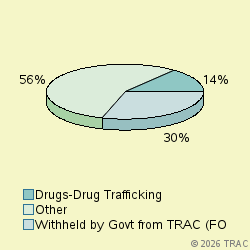
Cases were classified by prosecutors into more specific types.
The largest number of prosecutions of these matters in January 2026 was for "Withheld by Govt from TRAC (FOIA challen", accounting for 29.7 percent of prosecutions. Prosecutions were also filed for "Drugs-Drug Trafficking" (14.5%), "Weapons-Operation Triggerlock Major" (8.9%), "Project Safe Childhood" (6.9%), "Violence-Other" (4.9%), "Organized Crime-Emerging Organization" (4.3%), "Fraud-Other" (3.9%), "Drugs-Organized Crime Task Force" (3.4%), "Other Criminal Prosecutions" (3%), "Violence-Indian Country" (3%), "Bank Robbery" (2.7%). See Figure 2.
Prosecutions in U.S. Magistrate Courts
Top Ranked Lead Charges
In January 2026, 185 defendants in cases for these matters were filed in U.S. Magistrate Courts. These courts handle less serious misdemeanor cases, including what are called "petty offenses." In addition, complaints are sometimes filed in the magistrate courts before an indictment or information is entered. In these cases, the matter starts in the magistrate courts and later moves to the district court where subsequent proceedings take place.
In the magistrate courts in January the most frequently cited lead charge was Title 21 U.S.C Section 841 involving "Drug Abuse Prevention & Control-Prohibited acts A". This was the lead charge for 12.4 percent of all magistrate filings in January.
Other frequently prosecuted lead charges include: "21 USC 846 - Attempt and conspiracy" (9.2%), "18 USC 922 - Firearms; Unlawful acts" (7%).
Prosecutions in U.S. District Courts
In January 2026, 637 defendants in new cases for these matters were charged in the U.S. District Courts. In addition during January there were an additional 139 defendants whose cases moved from the magistrate courts to the U.S. district courts after an indictment or information was filed. The sections which follow cover both sets of cases and therefore cover all matters filed in district court during January.
Top Ranked Lead Charges
Table 2 shows the top lead charges recorded in the prosecutions of matters filed in U.S. District Court during January 2026 referred by the Federal Bureau of Investigation.
Lead Charge Count Rank 1yr ago 5yrs ago 21 USC 841 - Drug Abuse Prevention & Control-Prohibited acts A 75 1 1 1 More 18 USC 922 - Firearms; Unlawful acts 61 2 3 2 More 21 USC 846 - Attempt and conspiracy 53 3 2 3 More 18 USC 1951 - Hobbs Act 34 4 11 5 More 18 USC 1343 - Fraud by wire, radio, or television 29 5 4 4 More 18 USC 2252 - Material involving sexual exploitation of minors 26 6 5 6 More 18 USC 224 - Bribery in sporting contests 21 7 - - More 18 USC 2250 - Fail to register as sex offender after traveling interstate commerce 21 7 7 14 More 18 USC 2113 - Bank robbery and incidental crimes 20 9 8 7 More Table 2. Top Charges Filed
"Drug Abuse Prevention & Control-Prohibited acts A" (Title 21 U.S.C Section 841) was the most frequent recorded lead charge. "Drug Abuse Prevention & Control-Prohibited acts A" (Title 21 U.S.C Section 841) was ranked 1 a year ago, while it was ranked 1 five years ago.
Ranked 2nd in frequency was the lead charge "Firearms; Unlawful acts" under Title 18 U.S.C Section 922. "Firearms; Unlawful acts" under Title 18 U.S.C Section 922 was ranked 3 a year ago, while it was ranked 2 five years ago.
Ranked 3rd was "Attempt and conspiracy" under Title 21 U.S.C Section 846. "Attempt and conspiracy" under Title 21 U.S.C Section 846 was ranked 2 a year ago, while it was ranked 3 five years ago.
Among these top ten lead charges, the one showing the greatest increase in prosecutions — up 60.9 percent — compared to one year ago was Title 18 U.S.C Section 1951 that involves " Hobbs Act ". Compared to five years ago, the largest increase — 102.2 percent — was registered for prosecutions under " Fail to register as sex offender after traveling interstate commerce " (Title 18 U.S.C Section 2250 ).
Again among the top ten lead charges, the one showing the sharpest decline in prosecutions compared to one year ago — down 16.9 percent — was " Attempt and conspiracy " (Title 21 U.S.C Section 846 ). Compared to five years ago, the most significant decline in prosecutions — 30.2 percent — was for filings where the lead charge was " Firearms; Unlawful acts " (Title 18 U.S.C Section 922 ).
Top Ranked Judicial Districts
In January 2026 the Justice Department's case-by-case records show that the government brought 273.8 prosecutions for every ten million people in the United States.
Understandably, there is great variation in the per capita number of prosecutions that are filed in each of the nation's ninety-four federal judicial districts.
The districts registering the largest number of prosecutions per capita for these matters last month are shown in Table 3. Districts must have at least 5 prosecutions to receive a ranking.
Judicial District Percapita Count Rank 1yr ago 5yrs ago Ga, S 4,367 61 1 45 39 More D. C. 3,418 20 2 1 32 More N Dakota 1,808 12 3 36 76 More W Virg, N 1,418 11 4 72 60 More Montana 1,266 12 5 13 61 More La, W 920 16 6 45 66 More Tenn, E 894 21 7 44 33 More Okla, N 856 8 8 65 10 More N Mexico 845 15 9 18 11 More Mo, W 724 20 10 33 22 More Table 3. Top 10 Districts (per ten million people)
The Southern District of Georgia (Savannah) — with 4367 prosecutions as compared with 273.8 prosecutions per ten million population in the United States — was the most active during January 2026.
The District of Washington, D.C. (Washington) ranked 2nd. The District of Washington, D.C. (Washington) was ranked 1 a year ago.
District of North Dakota is now ranking 3rd.
Recent entrants to the top 10 list were Montana , now ranked 5th , and New Mexico at 9th In the same order, these districts ranked 13th and 18th one year ago and 61st and 11th five years ago.
The federal judicial district which showed the greatest growth in the rate of prosecutions compared to one year ago — 86.5 percent — was Eastern District of Tennessee (Knoxville). Compared to five years ago, the district with the largest growth — 140 percent — was North Dakota .
In the last year, the judicial District Court recording the largest drop in the rate of prosecutions — 71.4 percent — was Washington, D.C. (Washington). But over the past five years, Northern District of Oklahoma (Tulsa) showed the largest drop — 69.2 percent.
Top Ranked District Judges
At any one time, there are about 680 federal District Court judges working in the United States. The judges recorded with the largest number of new crime cases of this type during January 2026 are shown in Table 4.
Judge Count Rank 1yr ago 5yrs ago Quinones Alejandr, Nitza Ileana Penn, E 22 1 400 434 More Poplin, Debra C. Tenn, E 17 2 313 - More Hanen, Andrew S. Texas, S 12 3 25 234 More Summerhays, Robert Rees La, W 11 4 495 635 More Kelly, Timothy James D. C. 9 5 23 538 More Welte, Peter David N Dakota 8 6 20 140 More Wier, Robert Earl Ken, E 6 7 74 114 More Kays, David Gregory Mo, W 6 7 13 114 More Barker, J. Campbell Texas, E 6 7 204 434 More Dimitrouleas, William P. Fla, S 5 10 313 201 More Bough, Stephen Rogers Mo, W 5 10 313 161 More Hopkins, Jeffery Paul Ohio, S 5 10 245 - More Table 4. Top Ten Judges
A total of 6 out of the "top ten" judges were in districts which were in the top ten with the largest number of filings per capita, while the remaining 6 judges were from other districts. (Because of ties, there were a total of 12 judges in the "top ten" rankings.)
Judge Nitza Ileana Quinones Alejandr in the Eastern District of Pennsylvania (Philadelphia) ranked 1st with 22 defendants in cases.
Judge Debra C. Poplin in the Eastern District of Tennessee (Knoxville) ranked 2nd with 17 defendants in cases.
Judge Andrew S. Hanen in the Southern District of Texas (Houston) ranked 3rd with 12 defendants in cases.
Report Generated: April 16, 2026