Prosecutions for March 2026
Referring Agency: Federal Bureau of Investigation
The latest available data from the Justice Department show that during March 2026 the government reported 1134 new prosecutions for these matters. Those cases were referred by the Federal Bureau of Investigation. According to the case-by-case information analyzed by the Transactional Records Access Clearinghouse (TRAC), this number is up 25.9 percent over the previous month.
The comparisons of the number of defendants charged are based on case-by-case information obtained by TRAC under the Freedom of Information Act from the Executive Office for United States Attorneys (see Table 1).
When monthly 2026 prosecutions of this type are compared with those of the same period in the previous year, the number of filings was up (4.9%). Prosecutions over the past year are still much lower than they were five years ago. Overall, the data show that prosecutions of this type are down 8.5 percent from levels reported in 2021.
Figure 1. Monthly Trends in Prosecutions
The decrease from the levels five years ago in prosecutions for these matters is shown more clearly in Figure 1. The vertical bars in Figure 1 represent the number of prosecutions of this type recorded on a month-to-month basis. Where a prosecution was initially filed in U.S. Magistrate Court and then transferred to the U.S. District Court, the magistrate filing date was used since this provides an earlier indicator of actual trends. The superimposed line on the bars plots the six-month moving average so that natural fluctuations are smoothed out. The one and five-year rates of change in Table 1 and in the sections that follow are all based upon this six-month moving average. To view trends year-by-year rather than month-by-month, see TRAC's annual report series for a broader picture.
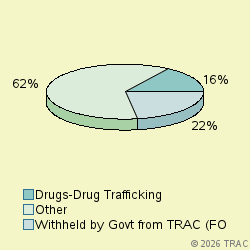
Cases were classified by prosecutors into more specific types.
The largest number of prosecutions of these matters in March 2026 was for "Withheld by Govt from TRAC (FOIA challen", accounting for 22.5 percent of prosecutions. Prosecutions were also filed for "Drugs-Drug Trafficking" (15.6%), "Weapons-Operation Triggerlock Major" (10.3%), "Project Safe Childhood" (10%), "Violence-Other" (5.2%), "Drugs-Organized Crime Task Force" (3.4%), "Violence-Indian Country" (3.4%), "Fraud-Computer" (3.3%), "Fraud-Other" (3%), "Other Criminal Prosecutions" (2.9%), "Theft-Interstate" (2.2%). See Figure 2.
Prosecutions in U.S. Magistrate Courts
Top Ranked Lead Charges
In March 2026, 217 defendants in cases for these matters were filed in U.S. Magistrate Courts. These courts handle less serious misdemeanor cases, including what are called "petty offenses." In addition, complaints are sometimes filed in the magistrate courts before an indictment or information is entered. In these cases, the matter starts in the magistrate courts and later moves to the district court where subsequent proceedings take place.
In the magistrate courts in March the most frequently cited lead charge was Title 21 U.S.C Section 841 involving "Drug Abuse Prevention & Control-Prohibited acts A". This was the lead charge for 17.1 percent of all magistrate filings in March.
Other frequently prosecuted lead charges include: "18 USC 922 - Firearms; Unlawful acts" (8.3%), "18 USC 2252 - Material involving sexual exploitation of minors" (7.8%).
Prosecutions in U.S. District Courts
In March 2026, 917 defendants in new cases for these matters were charged in the U.S. District Courts. In addition during March there were an additional 158 defendants whose cases moved from the magistrate courts to the U.S. district courts after an indictment or information was filed. The sections which follow cover both sets of cases and therefore cover all matters filed in district court during March.
Top Ranked Lead Charges
Table 2 shows the top lead charges recorded in the prosecutions of matters filed in U.S. District Court during March 2026 referred by the Federal Bureau of Investigation.
Lead Charge Count Rank 1yr ago 5yrs ago 21 USC 841 - Drug Abuse Prevention & Control-Prohibited acts A 140 1 1 1 More 18 USC 922 - Firearms; Unlawful acts 92 2 3 2 More 18 USC 1343 - Fraud by wire, radio, or television 89 3 4 4 More 21 USC 846 - Attempt and conspiracy 84 4 2 3 More 18 USC 2250 - Fail to register as sex offender after traveling interstate commerce 35 5 8 14 More 18 USC 2252 - Material involving sexual exploitation of minors 33 6 5 6 More 18 USC 113 - Assaults within maritime and territorial jurisdictions 28 7 9 10 More 18 USC 1951 - Hobbs Act 25 8 10 5 More 18 USC 1349 - Mail Fraud - Attempt and Conspiracy 22 9 13 8 More 18 USC 1956 - Laundering of monetary instruments 20 10 22 34 More Table 2. Top Charges Filed
"Drug Abuse Prevention & Control-Prohibited acts A" (Title 21 U.S.C Section 841) was the most frequent recorded lead charge. "Drug Abuse Prevention & Control-Prohibited acts A" (Title 21 U.S.C Section 841) was ranked 1 a year ago, while it was ranked 1 five years ago.
Ranked 2nd in frequency was the lead charge "Firearms; Unlawful acts" under Title 18 U.S.C Section 922. "Firearms; Unlawful acts" under Title 18 U.S.C Section 922 was ranked 3 a year ago, while it was ranked 2 five years ago.
Ranked 3rd was "Fraud by wire, radio, or television" under Title 18 U.S.C Section 1343. "Fraud by wire, radio, or television" under Title 18 U.S.C Section 1343 was ranked 4 a year ago, while it was ranked 4 five years ago.
Among these top ten lead charges, the one showing the greatest increase in prosecutions — up 70.1 percent — compared to one year ago was Title 18 U.S.C Section 1349 that involves " Mail Fraud - Attempt and Conspiracy ". Compared to five years ago, the largest increase — 155.6 percent — was registered for prosecutions under " Laundering of monetary instruments " (Title 18 U.S.C Section 1956 ).
Again among the top ten lead charges, the one showing the sharpest decline in prosecutions compared to one year ago — down 200 percent — was " " ( ). Compared to five years ago, the most significant decline in prosecutions — 25.9 percent — was for filings where the lead charge was " Firearms; Unlawful acts " (Title 18 U.S.C Section 922 ).
Top Ranked Judicial Districts
In March 2026 the Justice Department's case-by-case records show that the government brought 379.3 prosecutions for every ten million people in the United States.
Understandably, there is great variation in the per capita number of prosecutions that are filed in each of the nation's ninety-four federal judicial districts.
The districts registering the largest number of prosecutions per capita for these matters last month are shown in Table 3. Districts must have at least 5 prosecutions to receive a ranking.
Judicial District Percapita Count Rank 1yr ago 5yrs ago Nebraska 3,411 57 1 35 33 More D. C. 2,734 16 2 4 1 More Mo, W 1,881 52 3 51 22 More S Dakota 1,712 13 4 53 49 More La, E 1,383 19 5 65 68 More Montana 1,161 11 6 16 47 More Ark, W 1,086 13 7 85 79 More Okla, N 1,070 10 8 64 12 More La, W 920 16 9 38 64 More W Virg, N 902 7 10 74 56 More Table 3. Top 10 Districts (per ten million people)
The District of Nebraska — with 3411 prosecutions as compared with 379.3 prosecutions per ten million population in the United States — was the most active during March 2026.
The District of Washington, D.C. (Washington) ranked 2nd. The District of Washington, D.C. (Washington) was ranked 4 a year ago, while it was ranked 1 for most frequent use five years ago.
Western District of Missouri (Kansas City) is now ranking 3rd.
Recent entrants to the top 10 list were Montana , now ranked 6th , and Nebraska at 1st In the same order, these districts ranked 16th and 35th one year ago and 47th and 33rd five years ago.
The federal judicial district which showed the greatest growth in the rate of prosecutions compared to one year ago — 200 percent — was Western District of Arkansas (Fort Smith). Compared to five years ago, the district with the largest growth — 129 percent — was Western District of Louisiana (Shreveport).
In the last year, the judicial District Court recording the largest drop in the rate of prosecutions — 53.3 percent — was Washington, D.C. (Washington). This was the same district that had the largest increase — 74.6 percent — when compared with five years ago.
Top Ranked District Judges
At any one time, there are about 680 federal District Court judges working in the United States. The judges recorded with the largest number of new crime cases of this type during March 2026 are shown in Table 4.
Judge Count Rank Klausner, Robert G. Cal, C 19 1 More Sabraw, Dana Makoto Cal, S 10 2 More Rose, Thomas M. Ohio, S 10 2 More Hornsby, Mark L. La, W 9 4 More Kacsmaryk, Matthew Joseph Texas, N 9 4 More Rosenthal, Lee Hyman Texas, S 9 4 More Wilson, Stephen Victor Cal, C 8 7 More Immergut, Karin Johanna Oregon 8 7 More Phillips, Mary Elizabeth Mo, W 7 9 More Brann, Matthew William Penn, M 7 9 More Bissoon, Cathy Penn, W 7 9 More Table 4. Top Ten Judges
A total of 2 out of the "top ten" judges were in districts which were in the top ten with the largest number of filings per capita, while the remaining 9 judges were from other districts. (Because of ties, there were a total of 11 judges in the "top ten" rankings.)
Judge Robert G. Klausner in the Central District of California (Los Angeles) ranked 1st with 19 defendants in cases.
Judges Dana Makoto Sabraw in the Southern District of California (San Diego) and Thomas M. Rose in the Southern District of Ohio (Cincinnati) ranked 2nd with 10 defendants in cases.
Report Generated: May 21, 2026