Convictions for March 2026
Referring Agency: Federal Bureau of Investigation
The latest available data from the Justice Department show that during March 2026 the government reported 947 new convictions for these matters. Those cases were referred by the Federal Bureau of Investigation. According to the case-by-case information analyzed by the Transactional Records Access Clearinghouse (TRAC), this number is up 22.4 percent over the previous month.
The comparisons of the number of defendants convicted are based on case-by-case information obtained by TRAC under the Freedom of Information Act from the Executive Office for United States Attorneys (see Table 1).
When monthly 2026 convictions of this type are compared with those of the same period in the previous year, the number of convictions was only slightly up (0.9%). Convictions over the past year are still much higher than they were five years ago. Overall, the data show that convictions of this type are up 24.6 percent from levels reported in 2021.
Figure 1. Monthly Trends in Convictions
The increase from the levels five years ago in convictions for these matters is shown more clearly in Figure 1. The vertical bars in Figure 1 represent the number of convictions of this type recorded on a month-to-month basis. Where a prosecution was initially filed in U.S. Magistrate Court and then transferred to the U.S. District Court, the magistrate filing date was used since this provides an earlier indicator of actual trends. The superimposed line on the bars plots the six-month moving average so that natural fluctuations are smoothed out. The one and five-year rates of change in Table 1 and in the sections that follow are all based upon this six-month moving average. To view trends year-by-year rather than month-by-month, see TRAC's annual report series for a broader picture.
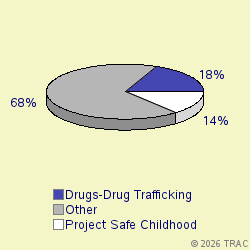
Cases were classified by prosecutors into more specific types.
The largest number of convictions of these matters in March 2026 was for "Drugs-Drug Trafficking", accounting for 18.5 percent of convictions. Convictions were also filed for "Project Safe Childhood" (13.9%), "Weapons-Operation Triggerlock Major" (13.4%), "Drugs-Organized Crime Task Force" (11.1%), "Fraud-Other" (4.5%), "Violence-Indian Country" (4.3%), "Violence-Other" (4.2%), "Other Criminal Prosecutions" (2.9%), "Bank Robbery" (2.4%), "Fraud-Health Care" (2.3%), "Withheld by Govt from TRAC (FOIA challen" (2.1%). See Figure 2.
Convictions in U.S. Magistrate Courts
Top Ranked Lead Charges
In March 2026, no defendants in cases for these matters were convicted in U.S. Magistrate Courts. These courts handle less serious misdemeanor cases, including what are called "petty offenses." In addition, complaints are sometimes filed in the magistrate courts before an indictment or information is entered. In these cases, the matter starts in the magistrate courts and later moves to the district court where subsequent proceedings take place.
Convictions in U.S. District Courts
In March 2026, 943 defendants in new cases for these matters were charged in the U.S. District Courts. In addition during March there were an additional 0 defendants whose cases moved from the magistrate courts to the U.S. district courts after an indictment or information was filed. The sections which follow cover both sets of cases and therefore cover all matters filed in district court during March.
Top Ranked Lead Charges
Table 2 shows the top lead charges recorded in the convictions of matters filed in U.S. District Court during March 2026 referred by the Federal Bureau of Investigation.
Lead Charge Count Rank 1yr ago 5yrs ago 21 USC 841 - Drug Abuse Prevention & Control-Prohibited acts A 170 1 1 1 More 18 USC 922 - Firearms; Unlawful acts 103 2 3 3 More 21 USC 846 - Attempt and conspiracy 96 3 2 2 More 18 USC 1343 - Fraud by wire, radio, or television 71 4 4 5 More 18 USC 2252 - Material involving sexual exploitation of minors 61 5 5 7 More 18 USC 2113 - Bank robbery and incidental crimes 26 6 8 4 More 18 USC 2250 - Fail to register as sex offender after traveling interstate commerce 24 7 11 16 More 18 USC 1951 - Hobbs Act 23 8 7 6 More 18 USC 1349 - Mail Fraud - Attempt and Conspiracy 21 9 9 11 More 18 USC 2252A - Activity relating material constituting/containing chil 21 9 12 9 More Table 2. Top Charges for Convictions
"Drug Abuse Prevention & Control-Prohibited acts A" (Title 21 U.S.C Section 841) was the most frequent recorded lead charge. "Drug Abuse Prevention & Control-Prohibited acts A" (Title 21 U.S.C Section 841) was ranked 1 a year ago, while it was ranked 1 five years ago.
Ranked 2nd in frequency was the lead charge "Firearms; Unlawful acts" under Title 18 U.S.C Section 922. "Firearms; Unlawful acts" under Title 18 U.S.C Section 922 was ranked 3 a year ago, while it was ranked 3 five years ago.
Ranked 3rd was "Attempt and conspiracy" under Title 21 U.S.C Section 846. "Attempt and conspiracy" under Title 21 U.S.C Section 846 was ranked 2 a year ago, while it was ranked 2 five years ago.
Among these top ten lead charges, the one showing the greatest increase in convictions — up 37.6 percent — compared to one year ago was Title 18 U.S.C Section 2250 that involves " Fail to register as sex offender after traveling interstate commerce ". This was the same statute that had the largest increase — 172.3 % — when compared with five years ago.
Again among the top ten lead charges, the one showing the sharpest decline in convictions compared to one year ago — down 27 percent — was " Mail Fraud - Attempt and Conspiracy " (Title 18 U.S.C Section 1349 ). Compared to five years ago, the most significant decline in convictions — 17.1 percent — was for convictions where the lead charge was " Bank robbery and incidental crimes " (Title 18 U.S.C Section 2113 ).
Top Ranked Judicial Districts
In March 2026 the Justice Department's case-by-case records show that the government obtained 332.7 convictions for every ten million people in the United States.
Understandably, there is great variation in the per capita number of convictions in each of the nation's ninety-four federal judicial districts.
The districts registering the largest number of convictions per capita for these matters last month are shown in Table 3. Districts must have at least 5 convictions to receive a ranking.
Judicial District Percapita Count Rank 1yr ago 5yrs ago D. C. 3,247 19 1 5 51 More Ga, S 1,575 22 2 68 30 More Montana 1,477 14 3 22 7 More Tenn, E 1,448 34 4 29 10 More Ala, S 1,369 10 5 70 48 More N Dakota 1,205 8 6 24 56 More Ill, C 1,062 19 7 70 70 More Okla, E 959 6 8 38 79 More S Dakota 922 7 9 51 37 More W Virg, S 858 6 10 80 67 More Table 3. Top 10 Districts (per ten million people)
The District of Washington, D.C. (Washington) — with 3247 convictions as compared with 332.7 convictions per ten million population in the United States — was the most active during March 2026. The District of Washington, D.C. (Washington) was ranked 5 a year ago.
The Southern District of Georgia (Savannah) ranked 2nd.
District of Montana is now ranking 3rd.
Recent entrants to the top 10 list were Montana , now ranked 3rd , and North Dakota at 6th In the same order, these districts ranked 22nd and 24th one year ago and 7th and 56th five years ago.
The federal judicial district which showed the greatest growth in the rate of convictions compared to one year ago — 133.3 percent — was Southern District of West Virginia (Charleston). Compared to five years ago, the district with the largest growth — 190.9 percent — was Eastern District of Oklahoma (Muskogee).
In the last year, the judicial District Court recording the largest drop in the rate of convictions — 53.8 percent — was North Dakota . But over the past five years, Eastern District of Tennessee (Knoxville) showed the largest drop — 30.1 percent.
Top Ranked District Judges
At any one time, there are about 680 federal District Court judges working in the United States. The judges recorded with the largest number of new crime cases resulting in convictions of this type during March 2026 are shown in Table 4.
Judge Count Rank Wood, Lisa Godbey Ga, S 15 1 More McDonough, Travis Randall Tenn, E 10 2 More Moon, Norman K. Virg, W 9 3 More Brinkema, Leonie M. Virg, E 8 4 More Flanagan, Louise W. N Car, E 7 5 More Rossiter, Robert F., Jr. Nebraska 7 5 More Hickey, Susan Owens Ark, W 6 7 More Welte, Peter David N Dakota 6 7 More Pittman, Mark Timothy Texas, N 6 7 More Wright, Otis D., II Cal, C 5 10 More Thurston, Jennifer L. Cal, E 5 10 More Covington, Virginia Maria Hernandez Fla, M 5 10 More Ebinger, Rebecca Goodgame Iowa, S 5 10 More Wier, Robert Earl Ken, E 5 10 More Cogburn, Max Oliver, Jr. N Car, W 5 10 More Simon, Michael Howard Oregon 5 10 More Brann, Matthew William Penn, M 5 10 More Velez-Rive, Camille L. Puer Rico 5 10 More Delgado Hernandez, Pedro Alberto Puer Rico 5 10 More Table 4. Top Ten Judges
A total of 3 out of the "top ten" judges were in districts which were in the top ten with the largest number of convictions per capita, while the remaining 16 judges were from other districts. (Because of ties, there were a total of 19 judges in the "top ten" rankings.)
Judge Lisa Godbey Wood in the Southern District of Georgia (Savannah) ranked 1st with 15 convicted in convictions.
Judge Travis Randall McDonough in the Eastern District of Tennessee (Knoxville) ranked 2nd with 10 convicted in convictions.
Judge Norman K. Moon in the Western District of Virginia (Roanoke) ranked 3rd with 9 convicted in convictions.
Report Generated: May 21, 2026