Weapons Prosecutions for June 2026
The latest available data from the Justice Department show that during June 2026 the government reported 677 new weapons prosecutions. According to the case-by-case information analyzed by the Transactional Records Access Clearinghouse (TRAC), this number is down 12.5 percent over the previous month.
The comparisons of the number of defendants charged with weapons-related offenses are based on case-by-case information obtained by TRAC under the Freedom of Information Act from the Executive Office for United States Attorneys (see Table 1).
When monthly 2026 prosecutions of this type are compared with those of the same period in the previous year, the number of filings was only slightly down (-1.5%). Prosecutions over the past year are still much lower than they were five years ago. Overall, the data show that prosecutions of this type are down 16.3 percent from levels reported in 2021.
Figure 1. Monthly Trends in Weapons Prosecutions
The decrease from the levels five years ago in weapons prosecutions for these matters is shown more clearly in Figure 1. The vertical bars in Figure 1 represent the number of weapons prosecutions of this type recorded on a month-to-month basis. Where a prosecution was initially filed in U.S. Magistrate Court and then transferred to the U.S. District Court, the magistrate filing date was used since this provides an earlier indicator of actual trends. The superimposed line on the bars plots the six-month moving average so that natural fluctuations are smoothed out. The one and five-year rates of change in Table 1 and in the sections that follow are all based upon this six-month moving average. To view trends year-by-year rather than month-by-month, see TRAC's annual report series for a broader picture.
Within the broad category of weapons, cases were classified by prosecutors into more specific types.
Case types within weapons are
Armed Career Criminal Act
Firearms/Triggerlock
Other Operation Triggerlock Prosecutions
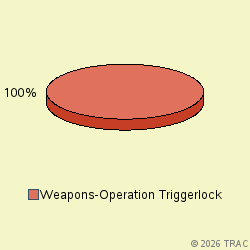
The largest number of prosecutions of these matters in June 2026 was for "Weapons-Operation Triggerlock Major", accounting for 100 percent of prosecutions. See Figure 2.
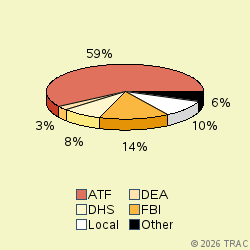
The lead investigative agency for weapons prosecutions in June 2026 was ATF accounting for 59 percent of prosecutions referred. Other agencies with substantial numbers of weapons referrals were: FBI (14% ), Local (10%), DHS (8%), DEA (3%). See Figure 3.
Weapons Prosecutions in U.S. Magistrate Courts
Top Ranked Lead Charges
In June 2026, 137 defendants in weapons cases for these matters were filed in U.S. Magistrate Courts. These courts handle less serious misdemeanor cases, including what are called "petty offenses." In addition, complaints are sometimes filed in the magistrate courts before an indictment or information is entered. In these cases, the matter starts in the magistrate courts and later moves to the district court where subsequent proceedings take place.
In the magistrate courts in June the most frequently cited lead charge was Title 18 U.S.C Section 922 involving "Firearms; Unlawful acts". This was the lead charge for 78.1 percent of all magistrate filings in June.
Weapons Prosecutions in U.S. District Courts
In June 2026, 540 defendants in new cases for these matters were charged in the U.S. District Courts. In addition during June there were an additional 122 defendants whose cases moved from the magistrate courts to the U.S. district courts after an indictment or information was filed. The sections which follow cover both sets of cases and therefore cover all matters filed in district court during June.
Top Ranked Lead Charges
Table 2 shows the top lead charges recorded in the prosecutions of weapons matters filed in U.S. District Court during June 2026.
Lead Charge Count Rank 1yr ago 5yrs ago 18 USC 922 - Firearms; Unlawful acts 531 1 1 1 More 21 USC 841 - Drug Abuse Prevention & Control-Prohibited acts A 31 2 3 4 More 18 USC 924 - Firearms; Penalties 18 3 5 5 More 18 USC 933 - Trafficking in firearms 18 3 - - More 18 USC 1951 - Hobbs Act 13 5 4 3 More 21 USC 846 - Attempt and conspiracy 12 6 9 8 More 18 USC 554 - Smuggling goods from the United States 8 7 7 7 More 26 USC 5861 - Tax on Making Firearms - Prohibited acts 8 7 6 6 More 18 USC 932 - Straw purchase firearms 5 9 - - More 18 USC 2113 - Bank robbery and incidental crimes 4 10 13 12 More Table 2. Top Charges Filed
"Firearms; Unlawful acts" (Title 18 U.S.C Section 922) was the most frequent recorded lead charge. "Firearms; Unlawful acts" (Title 18 U.S.C Section 922) was ranked 1 a year ago, while it was ranked 1 five years ago.
Ranked 2nd in frequency was the lead charge "Drug Abuse Prevention & Control-Prohibited acts A" under Title 21 U.S.C Section 841. "Drug Abuse Prevention & Control-Prohibited acts A" under Title 21 U.S.C Section 841 was ranked 3 a year ago, while it was ranked 4 five years ago.
Ranked 3rd were "Firearms; Penalties" under Title 18 U.S.C Section 924 and "Trafficking in firearms" under Title 18 U.S.C Section 933. "Firearms; Penalties" under Title 18 U.S.C Section 924 was ranked 5 a year ago, while it was ranked 5 five years ago.
Among these top ten lead charges, the one showing the greatest increase in prosecutions — up 384.6 percent — compared to one year ago was Title 21 U.S.C Section 846 that involves " Attempt and conspiracy ". This was the same statute that had the largest increase — 90.9 % — when compared with five years ago.
Again among the top ten lead charges, the one showing the sharpest decline in prosecutions compared to one year ago — down 11.3 percent — was " Hobbs Act " (Title 18 U.S.C Section 1951 ). This was the same statute that had the largest decrease — 23.9 % — when compared with five years ago.
Top Ranked Judicial Districts
In June 2026 the Justice Department's case-by-case records show that the government brought 233.6 weapons prosecutions for every ten million people in the United States.
Understandably, there is great variation in the per capita number of weapons prosecutions that are filed in each of the nation's ninety-four federal judicial districts.
The districts registering the largest number of prosecutions per capita for these matters last month are shown in Table 3. Districts must have at least 5 weapons prosecutions to receive a ranking.
Judicial District Percapita Count Rank 1yr ago 5yrs ago Tenn, W 2,546 33 1 28 12 More Montana 1,899 18 2 24 46 More D. C. 1,709 10 3 13 68 More Ark, E 1,307 18 4 55 10 More Iowa, N 1,165 13 5 18 20 More S Dakota 1,053 8 6 32 31 More Tenn, M 967 23 7 21 37 More Ala, M 896 9 8 19 70 More Mo, E 819 20 9 1 1 More Mo, W 651 18 10 7 7 More Table 3. Top 10 Districts (per ten million people)
The Western District of Tennessee (Memphis) — with 2546 prosecutions as compared with 233.6 prosecutions per ten million population in the United States — was the most active during June 2026.
The District of Montana ranked 2nd.
District of Washington, D.C. (Washington) is now ranking 3rd.
Recent entrants to the top 10 list were Washington, D.C. (Washington), now ranked 3rd , and Northern District of Iowa (Cedar Rapids) at 5th In the same order, these districts ranked 13th and 18th one year ago and 68th and 20th five years ago.
The federal judicial district which showed the greatest growth in the rate of weapons prosecutions compared to one year ago — 164.2 percent — was Western District of Tennessee (Memphis). Compared to five years ago, the district with the largest growth — 113 percent — was Middle District of Alabama (Montgomery).
In the last year, the judicial District Court recording the largest drop in the rate of weapons prosecutions — 28.6 percent — was Washington, D.C. (Washington). But over the past five years, Eastern District of Arkansas (Little Rock) showed the largest drop — 54.2 percent.
Top Ranked District Judges
At any one time, there are about 680 federal District Court judges working in the United States. The judges recorded with the largest number of new weapons crime cases of this type during June 2026 are shown in Table 4.
Judge Count Rank Crenshaw, Waverly David, Jr. Tenn, M 12 1 More Rose, Thomas M. Ohio, S 8 2 More Newman, Michael J. Ohio, S 8 2 More Norris, Mark Saalfield, Sr. Tenn, W 6 4 More Pitman, Robert Texas, W 6 4 More Michelson, Laurie Mich, E 5 6 More Trauger, Aleta Arthur Tenn, M 5 6 More Parker, Thomas Lee Robinson Tenn, W 5 6 More Kacsmaryk, Matthew Joseph Texas, N 5 6 More Middlebrooks, Donald M. Fla, S 4 10 More Limbaugh, Stephen Nathaniel, Jr. Mo, E 4 10 More Kays, David Gregory Mo, W 4 10 More McShane, Michael Jerome Oregon 4 10 More Lipman, Sheryl Halle Tenn, W 4 10 More Novak, David John Virg, E 4 10 More Table 4. Top Ten Judges
A total of 7 out of the "top ten" judges were in districts which were in the top ten with the largest number of weapons filings per capita, while the remaining 8 judges were from other districts. (Because of ties, there were a total of 15 judges in the "top ten" rankings.)
Judge Waverly David Crenshaw, Jr. in the Middle District of Tennessee (Nashville) ranked 1st with 12 defendants in weapons cases.
Judges Thomas M. Rose in the Southern District of Ohio (Cincinnati) and Michael J. Newman in the Southern District of Ohio (Cincinnati) ranked 2nd with 8 defendants in weapons cases.
Report Generated: August 12, 2026