Judge Jerrica A. Harness
FY 2021 - 2026*, Lumpkin Immigration Court
*data covers the first 9 months of fiscal year 2026
Published Aug 27, 2026
Jerrica A. Harness was appointed as an immigration judge to begin hearing cases in May 2024. Judge Harness earned a Bachelor of Arts in 2000 from Berry College and a Juris Doctor in 2007 from the University of Tennessee College of Law. From 2019 to 2024, she served as a supervisory administrative law judge for the Office of Medicare Hearings and Appeals, U.S. Department of Health and Human Services in Albuquerque, New Mexico. In 2019, she served as an assistant chief counsel with the Office of the Principal Legal Advisor, U.S. Immigration and Customs Enforcement, Department of Homeland Security, in Lumpkin, Georgia. From 2017 to 2019, she served as an attorney advisor with the Office of Hearings Operations, Social Security Administration in Falls Church, Virginia, and Knoxville, Tennessee. From 2012 to 2017, she served as an administrative hearing officer for the Tennessee Department of Human Services in Chattanooga, Tennessee. From 2011 to 2012, she served as a senior attorney for Children’s Legal Services, Department of Children and Families, State of Florida. From 2007 to 2012, she served as an assistant state attorney for the State Attorney’s Office of the First Judicial Circuit, State of Florida. Judge Harness is a member of the Tennessee Bar.
Deciding Asylum Cases
Detailed data on decisions by Judge Harness were examined for the period covering fiscal years 2021 through the first 9 months of 2026. During this period, court records show that Judge Harness decided 120 asylum claims on their merits. Of these, she granted asylum for 10, granted 14 other types of relief, and denied relief to 96. Converted to percentage terms, Harness denied 80.0 percent and granted 20.0 percent of asylum cases (including forms of relief other than asylum).
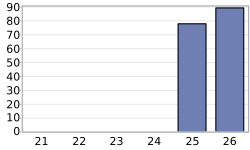
Figure 1 provides a comparison of Judge Harness's denial rate each fiscal year over this recent period. (Rates for years with less than 25 decisions are not shown.)
Nationwide Comparisons
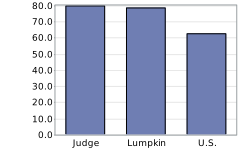
Compared to Judge Harness's denial rate of 80.0 percent, Immigration Court judges across the country denied 62.9 percent of asylum claims during this same period. Judges at the Lumpkin Immigration Court where Judge Harness decided these cases denied asylum 78.6 percent of the time. See Figure 2.
Judge Harness's asylum grant and denial rates are compared with other judges serving on the same court in this table. Note that when an Immigration Judge serves on more than one court during the same period, separate Immigration Judge reports are created for any Court in which the judge rendered at least 100 asylum decisions.
Why Do Denial Rates Vary Among Judges?
Although denial rates are shaped by each Judge's judicial philosophy, denial rates are also shaped by other factors, such as the types of cases on the Judge's docket, the detained status of immigrant respondents, current immigration policies, and other factors beyond an individual Judge's control. For example, TRAC has previously found that legal representation and the nationality of the asylum seeker are just two factors that appear to impact asylum decision outcomes.
The composition of cases may differ significantly between Immigration Courts in the country. Within a single Court when cases are randomly assigned to judges sitting on that Court, each Judge should have roughly a similar composition of cases given a sufficient number of asylum cases. Then variations in asylum decisions among Judges on the same Immigration Court would appear to reflect, at least in part, the judicial philosophy that the Judge brings to the bench. However, if judges within a Court are assigned to specialized dockets or hearing locations, then case compositions are likely to continue to differ and can contribute to differences in asylum denial rates.
Representation
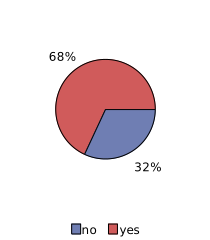
When asylum seekers are not represented by an attorney, almost all of them (74%) are denied asylum. In contrast, a significantly higher proportion of represented asylum seekers are successful. In the case of Judge Harness, 31.7% were not represented by an attorney. See Figure 3. For the nation as a whole, about 18.8% of asylum seekers are not represented.
Nationality
Asylum seekers are a diverse group. Over one hundred different nationalities had at least one hundred individuals claiming asylum decided during this period. As might be expected, immigration courts located in different parts of the country tend to have proportionately larger shares from some countries than from others. And, given the required legal grounds for a successful asylum claim, asylum seekers from some nations tend to be more successful than others.
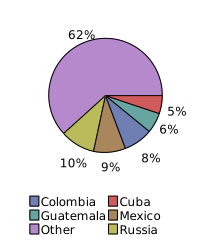
The largest group of asylum seekers appearing before Judge Harness came from Russia. Individuals from this country made up 10.0% of her caseload. Other nationalities in descending order of frequency appearing before Judge Harness were: Mexico (9.2%), Colombia (8.3%), Guatemala (5.8%), Cuba (5.0%). See Figure 4.
In the nation as a whole during this same period, major nationalities of asylum seekers, in descending order of frequency, were Honduras (10.1%), Guatemala (9.4%), Mexico (9.1%), El Salvador (8.7%), Venezuela (6.8%), Colombia (5.6%), Ecuador (5.3%), Nicaragua (4.8%), India (4.7%), China (4.7%), Russia (3.3%), Brazil (3.2%), Peru (2.9%).