Surge in Immigration Lawsuits Hits Record High in 2026
Published May 11, 2026
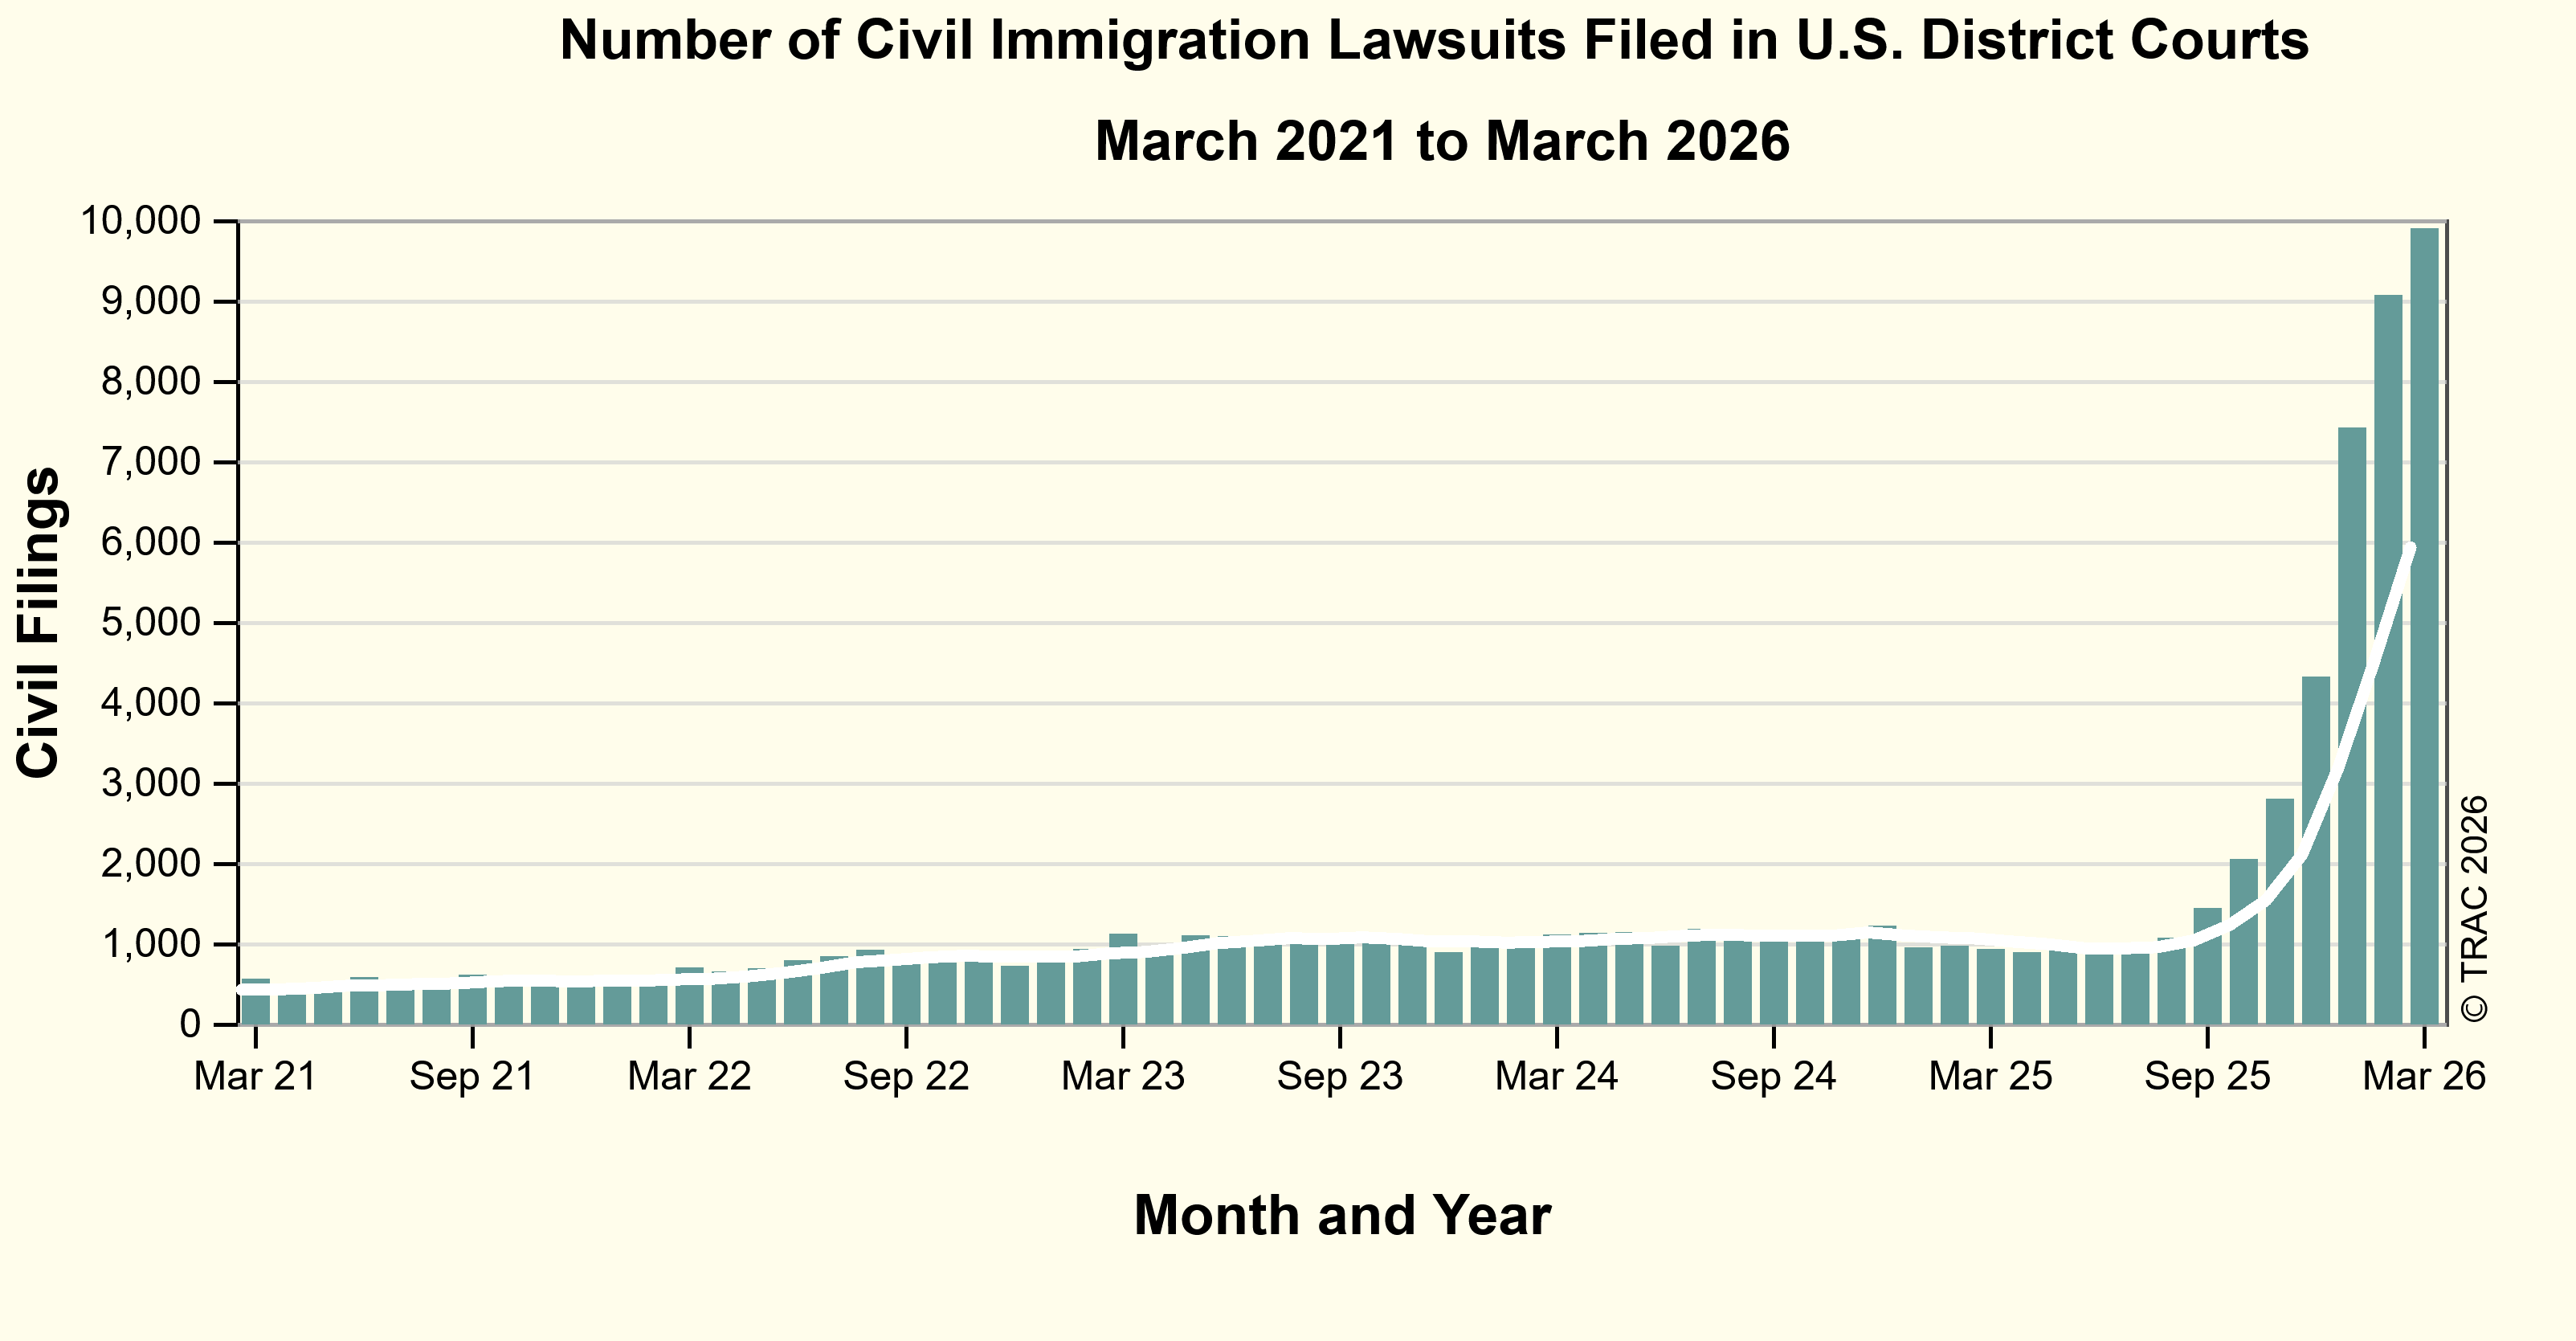
The latest available data from the federal courts show that during March 2026 the government reported 9,911 new lawsuits filed involving immigration matters. According to the case-by-case information analyzed by the Transactional Records Access Clearinghouse (TRAC), this number is up 9.2 percent over the previous month when the number of immigration lawsuits totaled 9,077. A further rapid rise in these lawsuits occurred during the last year when an unprecedented total of 41,887 federal suits classified as involving immigration matters were filed - most of these challenging actions of the federal government.
The long-term trend in civil filings for these matters over the past five years is shown in Figure 1. The vertical bars in Figure 1 represent the number of civil immigration filings recorded each month, while the superimposed line plots the six-month moving average. The graph makes clear how striking and unusual the recent jump in lawsuits has been. Overall, the data represented by the moving average shows that civil immigration filings are up 1,278 percent from levels reported in March 2021.
While many categories of immigration litigation were little changed over the past year, marked growth occurred for naturalization and habeas corpus lawsuits. Habeas lawsuits increased by over 85 times during the past year, while naturalization suits were 1.8 times higher than in March 2025. See Table 1.
| Month | Immigration Civil Litigation | |||
|---|---|---|---|---|
| Total | Habeas | Naturalization | Other | |
| Mar 2025 | 945 | 105 | 33 | 807 |
| Apr 2025 | 905 | 121 | 31 | 753 |
| May 2025 | 965 | 167 | 28 | 770 |
| Jun 2025 | 918 | 254 | 30 | 634 |
| Jul 2025 | 958 | 280 | 45 | 633 |
| Aug 2025 | 1,079 | 414 | 31 | 634 |
| Sept 2025 | 1,447 | 733 | 36 | 678 |
| Oct 2025 | 2,060 | 1,392 | 21 | 647 |
| Nov 2025 | 2,807 | 2,202 | 22 | 583 |
| Dec 2025 | 4,327 | 3,642 | 36 | 649 |
| Jan 2025 | 7,433 | 6,780 | 35 | 618 |
| Feb 2025 | 9,077 | 8,282 | 46 | 749 |
| Mar 2026 | 9,911 | 9,059 | 60 | 792 |
| Ratio: March 2026 vs March 2025 | 10.5 | 86.3 | 1.8 | 1.0 |
While most naturalization suits sought court orders to compel the government to act on an immigrant’s naturalization application, to hold hearings on the application or challenged the decision itself, the sharp jump in habeas corpus lawsuits has been driven by the rapid increase in the Trump administration’s actions to arrest, detain and rapidly deport thousands of immigrants.
A habeas corpus lawsuit requests that a judge order a detainee brought before the court and government officials explain why they have the authority to detain that person. The legal right to file a habeas corpus suit is enshrined in Article 1, Section 9 of the U.S. Constitution. This right is centuries old and serves as an essential bulwark against arbitrary imprisonment. Over the last year, immigrant rights attorneys have mounted major campaigns to file such suits and counteract the Immigration and Customs Enforcement’s (ICE) expedited and increasing detention and deportation activity.
As shown in Figure 2, the rise in habeas corpus lawsuits today is striking and appears unprecedented. Available statistics for previous periods do not ever show a time when similar numbers of such suits were filed.[1]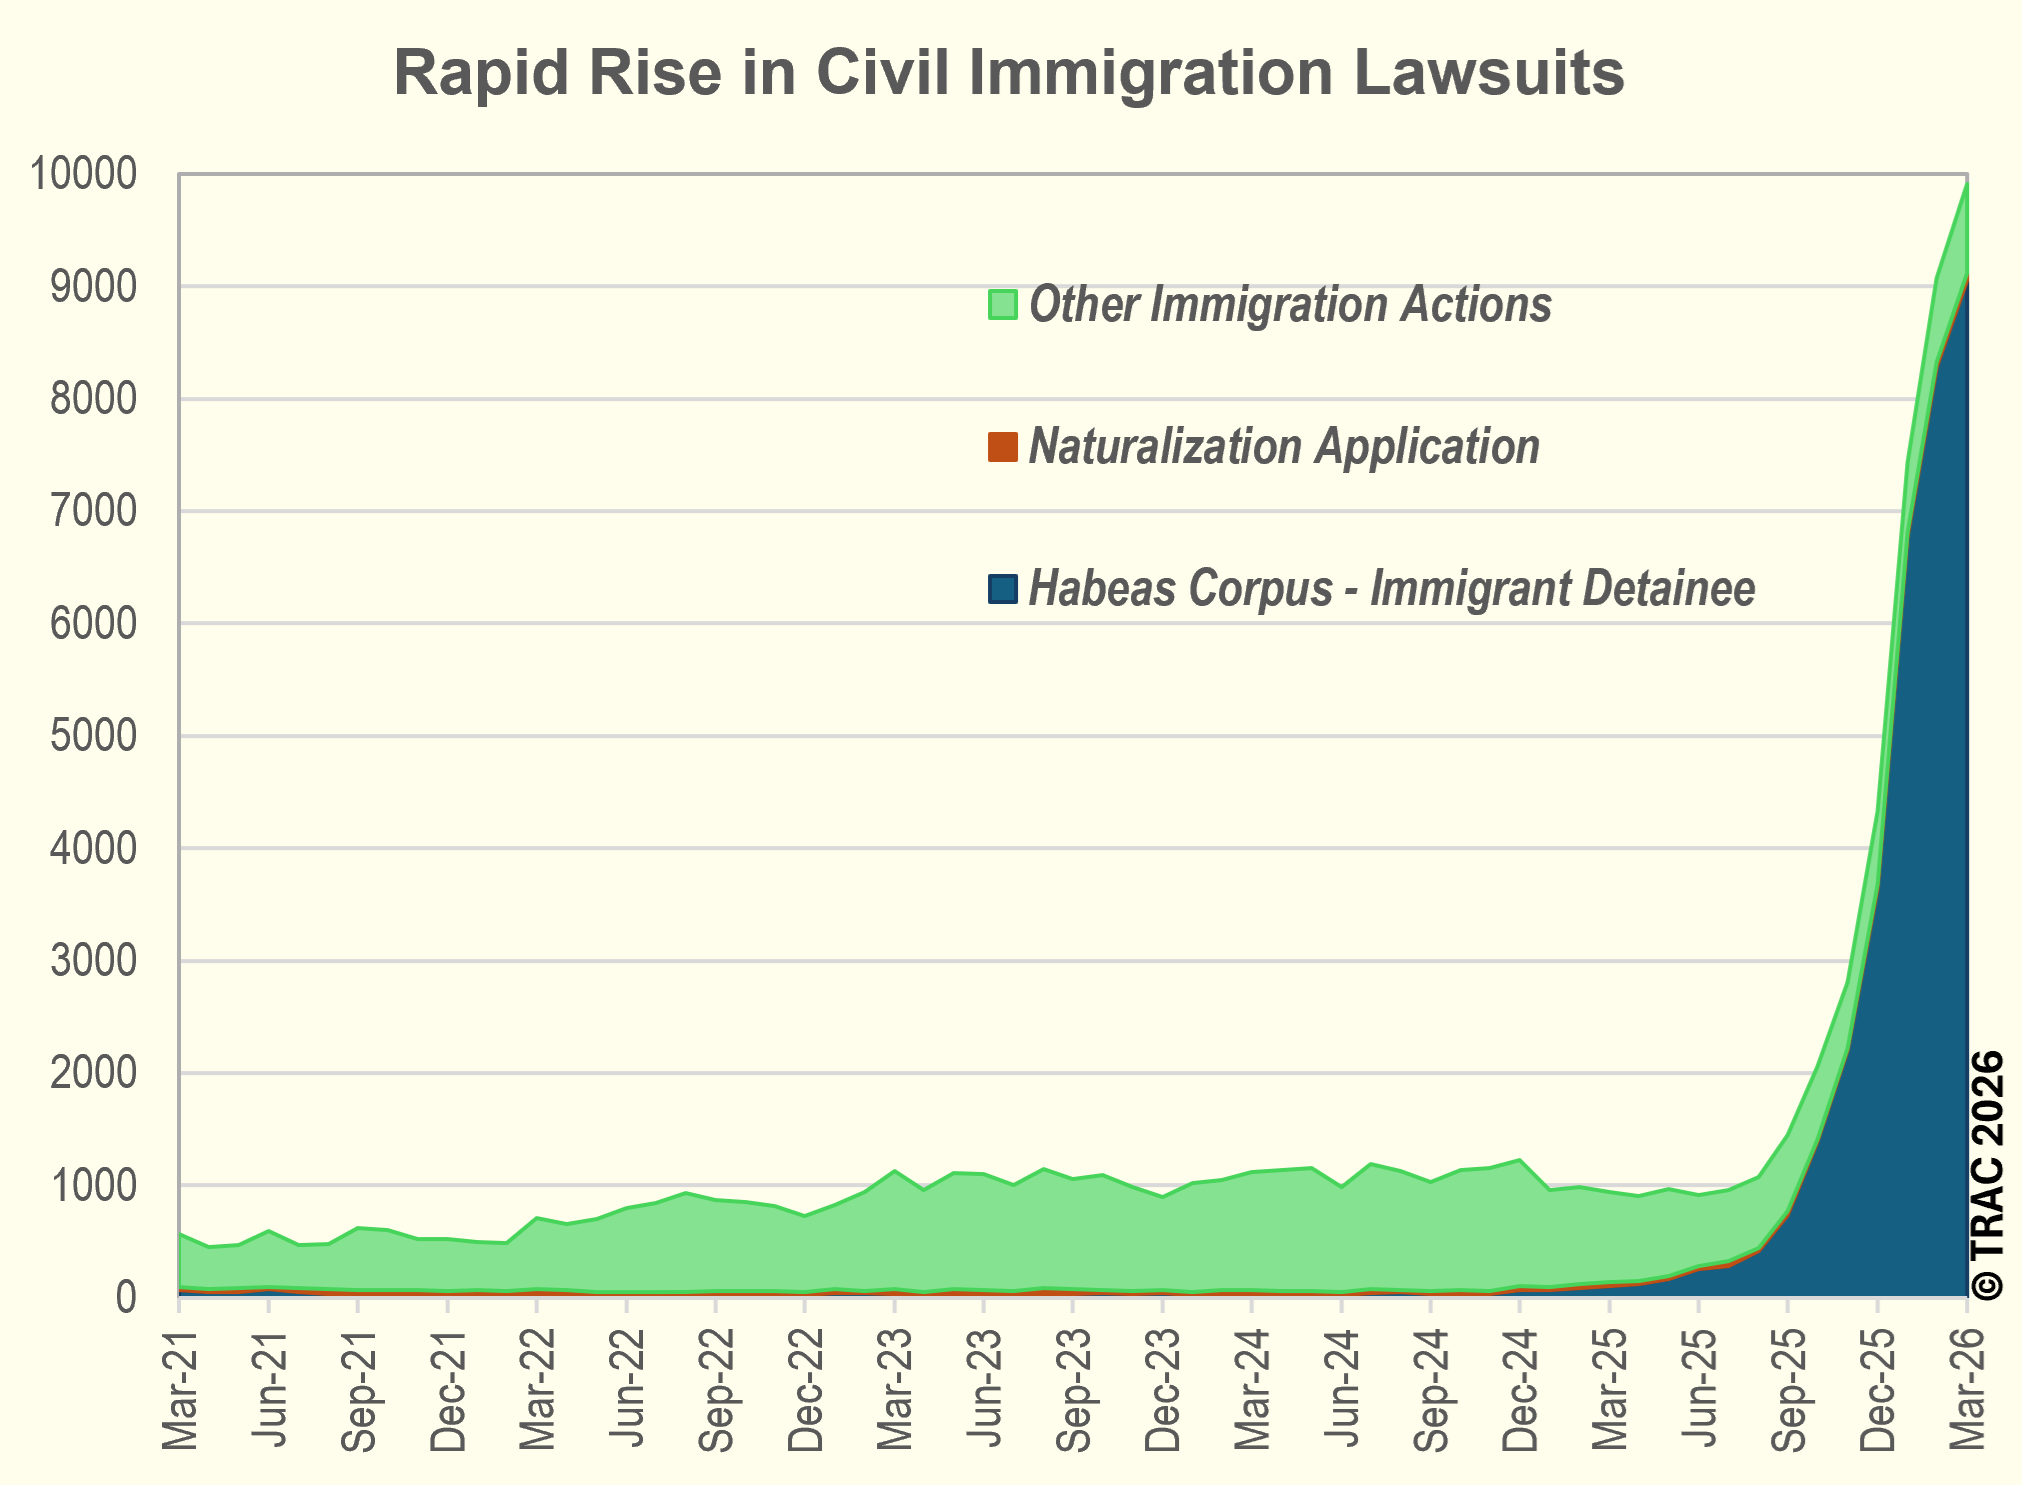
Where Are Habeas Corpus Suits Being Filed?
A total of 82 out of 90 federal judicial districts in the United States saw habeas corpus lawsuits filed during the last six months (October 2025 - March 2026). A total of 10 of these districts had more than 1,000 suits filed. The Western District of Texas (San Antonio) topped this list with 3,448 suits instituted. Two districts had over 2,000 suits filed during this period: the Eastern District of California (Sacramento) with 2,797 filings and the Southern District of Texas (Houston) with 2,305 lawsuits filed.
An additional seven districts had more than 1,000 suits. Two of these were located along the southwest border with Mexico: The Southern District of California (San Diego) with 1,740 habeas lawsuits and Arizona with 1,104 suits filed during the last six months. The fifth and sixth place in the top ten were the Central District of California (Los Angeles) with 1,370 habeas filings, and Minnesota with 1,200 suits. Widespread news coverage had been given to unprecedented ICE-targeted immigration enforcement actions in each of these districts. Other ICE enforcement activity in the Middle District of Florida (Tampa) resulted in 1,196 habeas suits, in the Western District of Michigan (Grand Rapids) resulting in 1,084 suits and in New Jersey with 1,010 filings. These three districts comprised the rest of the ten districts with the greatest number of habeas lawsuits filed during the last six months. See Table 2.
Relative to population size, five additional districts made the top ten. These included the Western District of Louisiana (Shreveport), New Mexico, the Middle District of Georgia (Macon), the Southern District of Georgia (Savannah), and the Western District of New York (Buffalo). Per capita filings in the top ten districts ranged from 211 to 500 lawsuits per million population.
After adjusting for their relative population size, rankings also shifted somewhat for districts that were ranked highest on their sheer number of lawsuits. The Southern District of California (San Diego) climbed to the top place with the largest number of lawsuits relative to its population size, followed by the Western District of Texas (San Antonio). Five districts dropped out of the top ten rankings when just the number of suits were compared. For per capita rates and rankings of the top ten districts see Table 3.
| Judicial District | Lawsuits | Ranking | ||
|---|---|---|---|---|
| Number | Rate* | Number | Rate* | |
| All | 31,357 | 92.2 | - | - |
| Texas, W | 3,448 | 425.4 | 1 | 2 |
| Cal, E | 2,797 | 331.4 | 2 | 6 |
| Texas, S | 2,305 | 215.8 | 3 | 9 |
| Cal, S | 1,740 | 499.9 | 4 | 1 |
| Cal, C | 1,370 | 71.2 | 5 | 30 |
| Minnesota | 1,200 | 207.1 | 6 | 11 |
| Fla, M | 1,196 | 88.9 | 7 | 26 |
| Arizona | 1,104 | 145.6 | 8 | 15 |
| Mich, W | 1,084 | 301.3 | 9 | 8 |
| N. J. | 1,010 | 106.3 | 10 | 24 |
| Judicial District | Lawsuits | Ranking | ||
|---|---|---|---|---|
| Number | Rate* | Number | Rate* | |
| All | 31,357 | 92.2 | - | - |
| Cal, S | 1,740 | 499.9 | 4 | 1 |
| Texas, W | 3,448 | 425.4 | 1 | 2 |
| La, W | 816 | 391.0 | 14 | 3 |
| N Mexico | 782 | 367.1 | 15 | 4 |
| Ga, M | 738 | 350.6 | 16 | 5 |
| Cal, E | 2,797 | 331.4 | 2 | 6 |
| Ga, S | 530 | 316.2 | 20 | 7 |
| Mich, W | 1,084 | 301.3 | 9 | 8 |
| Texas, S | 2,305 | 215.8 | 3 | 9 |
| N. Y., W | 592 | 210.8 | 19 | 10 |