Removal Orders Jump While Immigration Court Closures Top 100,000 in June 2026
Published Jul 21, 2026
The latest case-by-case Immigration Court records reveal that case closures during June 2026 climbed to an all-time high of 100,773 -- largely driven by a 30 percent jump in removals ordered by Immigration Judges.
Removal orders initially climbed to roughly 50,000 during the initial months of the Trump administration. Numbers didn’t climb any higher for a year. Then in March 2026 removals rose to 60,000 and stayed around that level through April and May before jumping to just under 79,000 in June. See Figure 1.
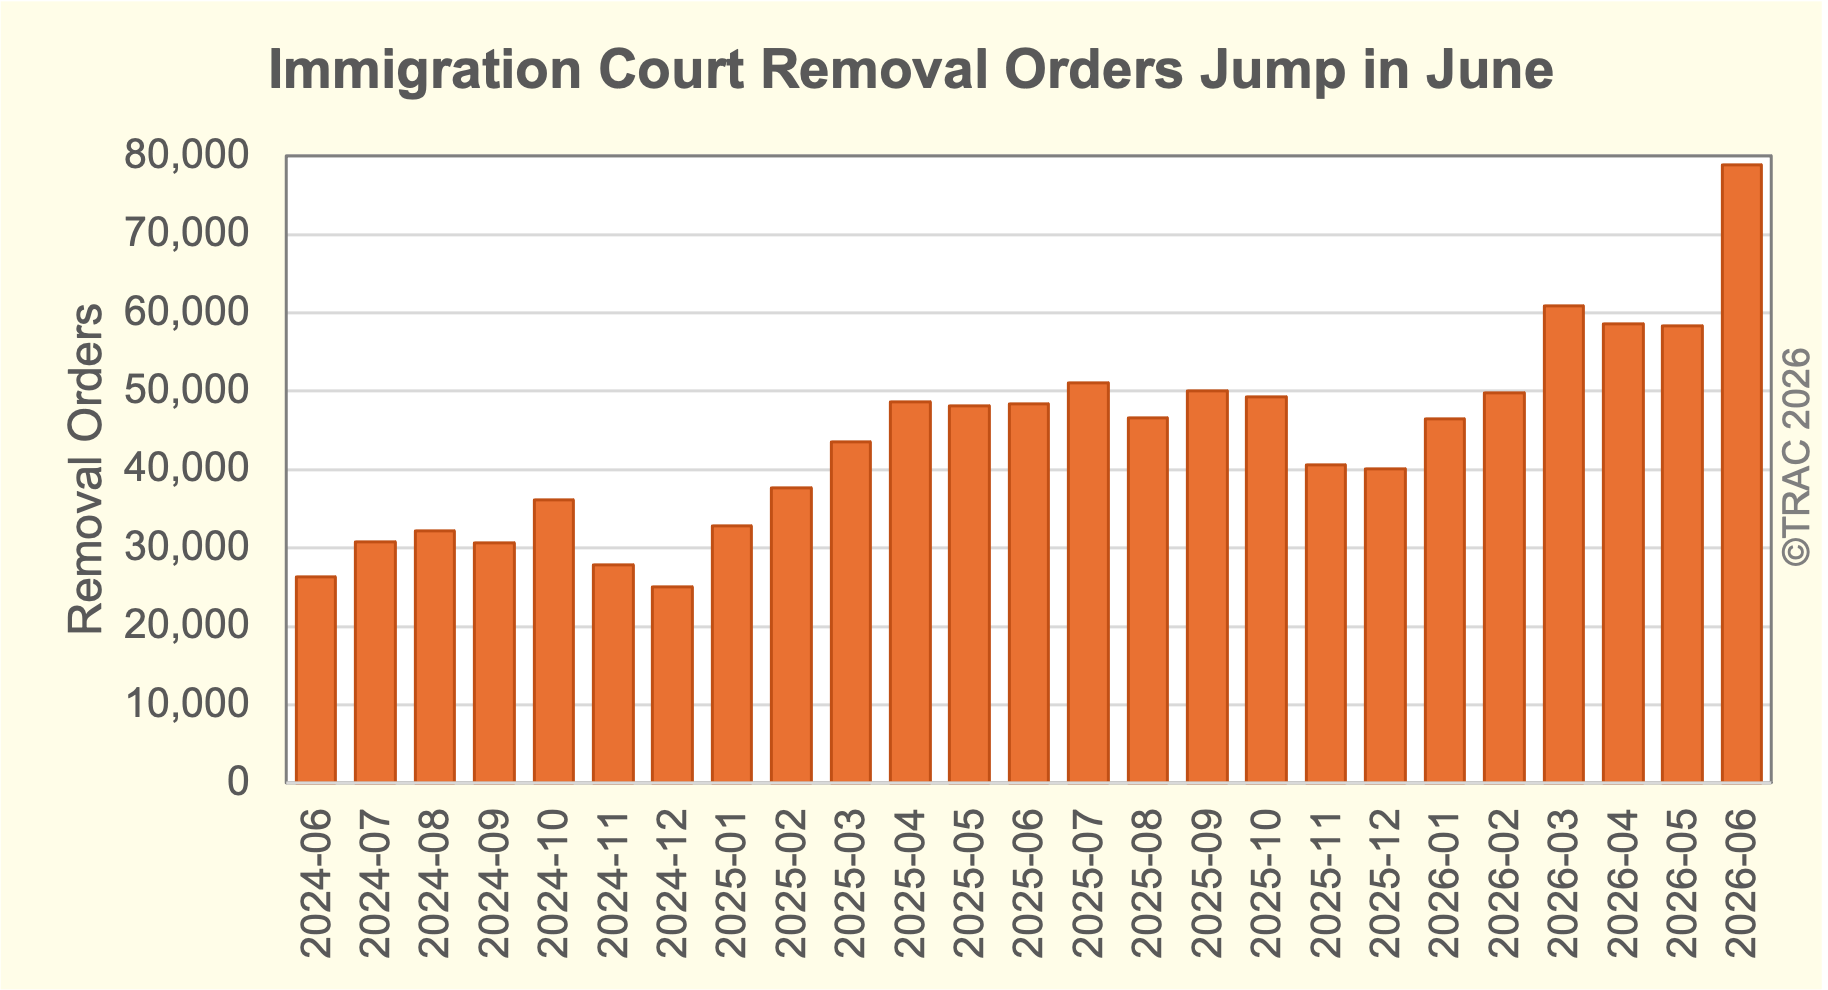
June 2024 - June 2026.
During the March through June 2026 period removal orders also accounted for a larger proportion of all case closures, rising from 70% to 78%. In June, less than two percent (1.9%) of individuals in cases that closed were granted relief. See Table 1. Over two-thirds (68%) of individuals were not present at the court hearing where they were ordered removed.[1]
| Month and Year* | All | Removal Ordered | Voluntary Departure | Proceedings Terminated | Relief Granted | Other Closures |
|---|---|---|---|---|---|---|
| Number of Closed Immigration Court Cases | ||||||
| 2026-06 | 100,773 | 78,882 | 7,689 | 8,417 | 1,883 | 3,902 |
| 2026-05 | 78,981 | 58,339 | 7,418 | 7,927 | 2,048 | 3,249 |
| 2026-04 | 82,036 | 58,622 | 8,513 | 9,259 | 1,558 | 4,084 |
| 2026-03 | 86,481 | 60,878 | 9,242 | 10,064 | 2,342 | 3,955 |
| Percent of All Closed Immigration Court Cases | ||||||
| 2026-06 | 100.0% | 78.3% | 7.6% | 8.4% | 1.9% | 3.9% |
| 2026-05 | 100.0% | 73.9% | 9.4% | 10.0% | 2.6% | 4.1% |
| 2026-04 | 100.0% | 71.5% | 10.4% | 11.3% | 1.9% | 5.0% |
| 2026-03 | 100.0% | 70.4% | 10.7% | 11.6% | 2.7% | 4.6% |
Growing removal orders during the current administration continued trends seen during the previous Biden administration. Between June 2021 and June 2024, for example, Immigration Court completions jumped nearly fivefold, and removal orders grew even faster as the proportion of cases resulting in removal orders doubled. Month-by-month figures covering the last quarter century are available here.
Large State-by-State Differences in Recent Removal Trends
Among the states with the five largest Immigration Courts, two states – Texas and Illinois – had above average growth in removal orders during March through June 2026, while the remaining three of these largest courts in Florida, New York, and California experienced below average increases.
Immigrants in the Immigration Court in Illinois (Chicago) experienced a 120 percent jump in the number of removals ordered – four times the national increase. Individuals in courts based in five additional states experienced at least twice the national jump in removals ordered. These involved the courts in Massachusetts (up 79%), New Jersey (up 66%), Pennsylvania (up 66%), Texas (up 66%) and Colorado (up 60%).
At the other extreme, courts based in six states experienced a drop in the number of immigrants ordered removed between March and June 2026. Fewer individuals were ordered removed in courts based in Virginia (down 5%), Arizona (down 12%), Georgia (down 15%), California (down 22%), Washington (down 35%) and Hawaii (down 45%) .
Table 2 provides the number of removals and the percent of change between March and June 2026 for each state.[2]
| Immigration Court State* | Number of Removal Orders | Percent Change | |||
|---|---|---|---|---|---|
| 2026-03 | 2026-04 | 2026-05 | 2026-06 | ||
| All | 60,878 | 58,622 | 58,339 | 78,882 | 30% |
| Illinois | 3,228 | 3,576 | 3,928 | 7,087 | 120% |
| Massachusetts | 945 | 822 | 815 | 1,692 | 79% |
| New Jersey | 1,704 | 1,870 | 1,853 | 2,835 | 66% |
| Pennsylvania | 1,204 | 1,131 | 1,104 | 2,001 | 66% |
| Texas | 12,569 | 12,843 | 14,316 | 20,840 | 66% |
| Colorado | 599 | 779 | 958 | 956 | 60% |
| Missouri | 465 | 482 | 660 | 714 | 54% |
| Nevada | 224 | 330 | 309 | 326 | 46% |
| Louisiana | 1,809 | 1,962 | 1,985 | 2,626 | 45% |
| Oregon | 293 | 406 | 461 | 418 | 43% |
| Nebraska | 664 | 610 | 496 | 913 | 38% |
| North Carolina | 2,111 | 2,137 | 2,285 | 2,817 | 33% |
| Maryland | 1,352 | 1,444 | 1,337 | 1,775 | 31% |
| Utah | 522 | 495 | 675 | 674 | 29% |
| Tennessee | 1,381 | 1,418 | 1,653 | 1,753 | 27% |
| Indiana | 1,048 | 774 | 778 | 1,330 | 27% |
| New York | 5,784 | 5,311 | 4,745 | 7,110 | 23% |
| Connecticut | 690 | 480 | 780 | 823 | 19% |
| Florida | 4,605 | 4,651 | 4,264 | 5,415 | 18% |
| Michigan | 535 | 489 | 496 | 613 | 15% |
| Minnesota | 785 | 844 | 885 | 893 | 14% |
| New Mexico | 227 | 174 | 213 | 250 | 10% |
| Ohio | 1,108 | 1,036 | 1,162 | 1,201 | 8% |
| Virginia | 2,203 | 2,311 | 2,258 | 2,097 | -5% |
| Arizona | 1,364 | 1,240 | 1,291 | 1,204 | -12% |
| Georgia | 3,065 | 3,179 | 2,361 | 2,590 | -15% |
| California | 8,846 | 6,760 | 5,332 | 6,934 | -22% |
| Washington | 1,484 | 1,009 | 890 | 960 | -35% |
| Hawaii | 22 | 30 | 11 | 12 | -45% |
Removals Ordered by Nationality
There were also large differences in removal trends across nationalities. While some differences may have been attributable to where immigrants lived and hence the particular courts in which their cases were heard, the reasons for other differences were less obvious. Among immigrants from countries with the highest number of cases, Haitians experienced a 96 percent increase in removal orders between March and June 2026, while individuals from the Dominican Republic and Brazil each experienced over a 50 percent jump in removal orders compared with the national average of a 30 percent rise.
At the other end of the continuum, immigrants from Cuba saw just a 5 percent rise, while individuals from El Salvador and Nicaragua experienced just a 12 percent or 15 percent growth, respectively – well below the national average.
Immigrants from Romania, although fewer in number, experienced one of the largest increases in removal orders – from 170 ordered removed in March to 595 ordered removed in June, a jump of 250 percent. Other nationalities experienced actual declines in removal orders during this same period – Mauritania (down 14%), Somalia (down 15%), Senegal (down 17%), Bangladesh (down 37%) and Guinea (down 55%).
Table 3 provides the number of removals and the percent of change from March to June 2026 for over 30 nationalities. For comparable figures for smaller nationality groups see TRAC’s public dashboard “Outcomes of Immigration Court Proceedings.”
| Nationality of Individuals Ordered Removed* | Number of Removal Orders | Percent Change | |||
|---|---|---|---|---|---|
| 2026-03 | 2026-04 | 2026-05 | 2026-06 | ||
| All | 60,878 | 58,622 | 58,339 | 78,882 | 30% |
| Romania | 170 | 226 | 151 | 595 | 250% |
| Haiti | 792 | 902 | 989 | 1,550 | 96% |
| Turkiye | 216 | 251 | 225 | 419 | 94% |
| Georgia | 84 | 101 | 71 | 162 | 93% |
| Chile | 80 | 80 | 93 | 150 | 88% |
| Jamaica | 161 | 214 | 225 | 280 | 74% |
| Nigeria | 173 | 211 | 236 | 299 | 73% |
| Vietnam | 96 | 137 | 117 | 153 | 59% |
| Dominican Republic | 787 | 658 | 729 | 1,206 | 53% |
| Brazil | 1,218 | 1,080 | 1,161 | 1,853 | 52% |
| China | 579 | 652 | 710 | 877 | 51% |
| Honduras | 6,980 | 7,364 | 7,476 | 9,686 | 39% |
| Venezuela | 7,883 | 7,379 | 7,813 | 10,939 | 39% |
| Russia | 331 | 354 | 360 | 457 | 38% |
| Peru | 1,624 | 1,568 | 1,670 | 2,167 | 33% |
| Ecuador | 3,349 | 2,850 | 3,155 | 4,463 | 33% |
| Guatemala | 6,673 | 7,074 | 6,125 | 8,340 | 25% |
| Mexico | 12,641 | 12,073 | 11,469 | 15,773 | 25% |
| Colombia | 4,313 | 3,788 | 3,857 | 5,255 | 22% |
| Ghana | 87 | 83 | 87 | 103 | 18% |
| Nicaragua | 3,783 | 2,976 | 3,193 | 4,365 | 15% |
| Uzbekistan | 156 | 153 | 137 | 180 | 15% |
| Bolivia | 283 | 253 | 227 | 318 | 12% |
| El Salvador | 2,835 | 2,890 | 2,719 | 3,182 | 12% |
| India | 742 | 829 | 840 | 801 | 8% |
| Cuba | 1,560 | 1,333 | 1,444 | 1,642 | 5% |
| Cameroon | 115 | 108 | 105 | 120 | 4% |
| Mauritania | 272 | 240 | 211 | 234 | -14% |
| Somalia | 163 | 167 | 192 | 138 | -15% |
| Senegal | 368 | 325 | 295 | 306 | -17% |
| Bangladesh | 129 | 142 | 109 | 81 | -37% |
| Guinea | 294 | 183 | 122 | 133 | -55% |
More Details
The last year also saw an increase in the number of new proceedings filed in Immigration Court by the Department of Homeland Security (DHS). Compared to June 2025, new cases have grown from 31,000 to 52,000 in June 2026. While closures are now consistently outpacing new cases, the Immigration Court’s case backlog remains stubbornly high with 3.2 million immigrants waiting for their cases to be decided.