Too Few Immigration Attorneys; Where You Live Impacts Representation
Published Sep 15, 2026
The latest available court data show that in August 2026 only one in four (24%) immigrants, including unaccompanied children had an attorney to assist them in Immigration Court cases when a removal order was issued.
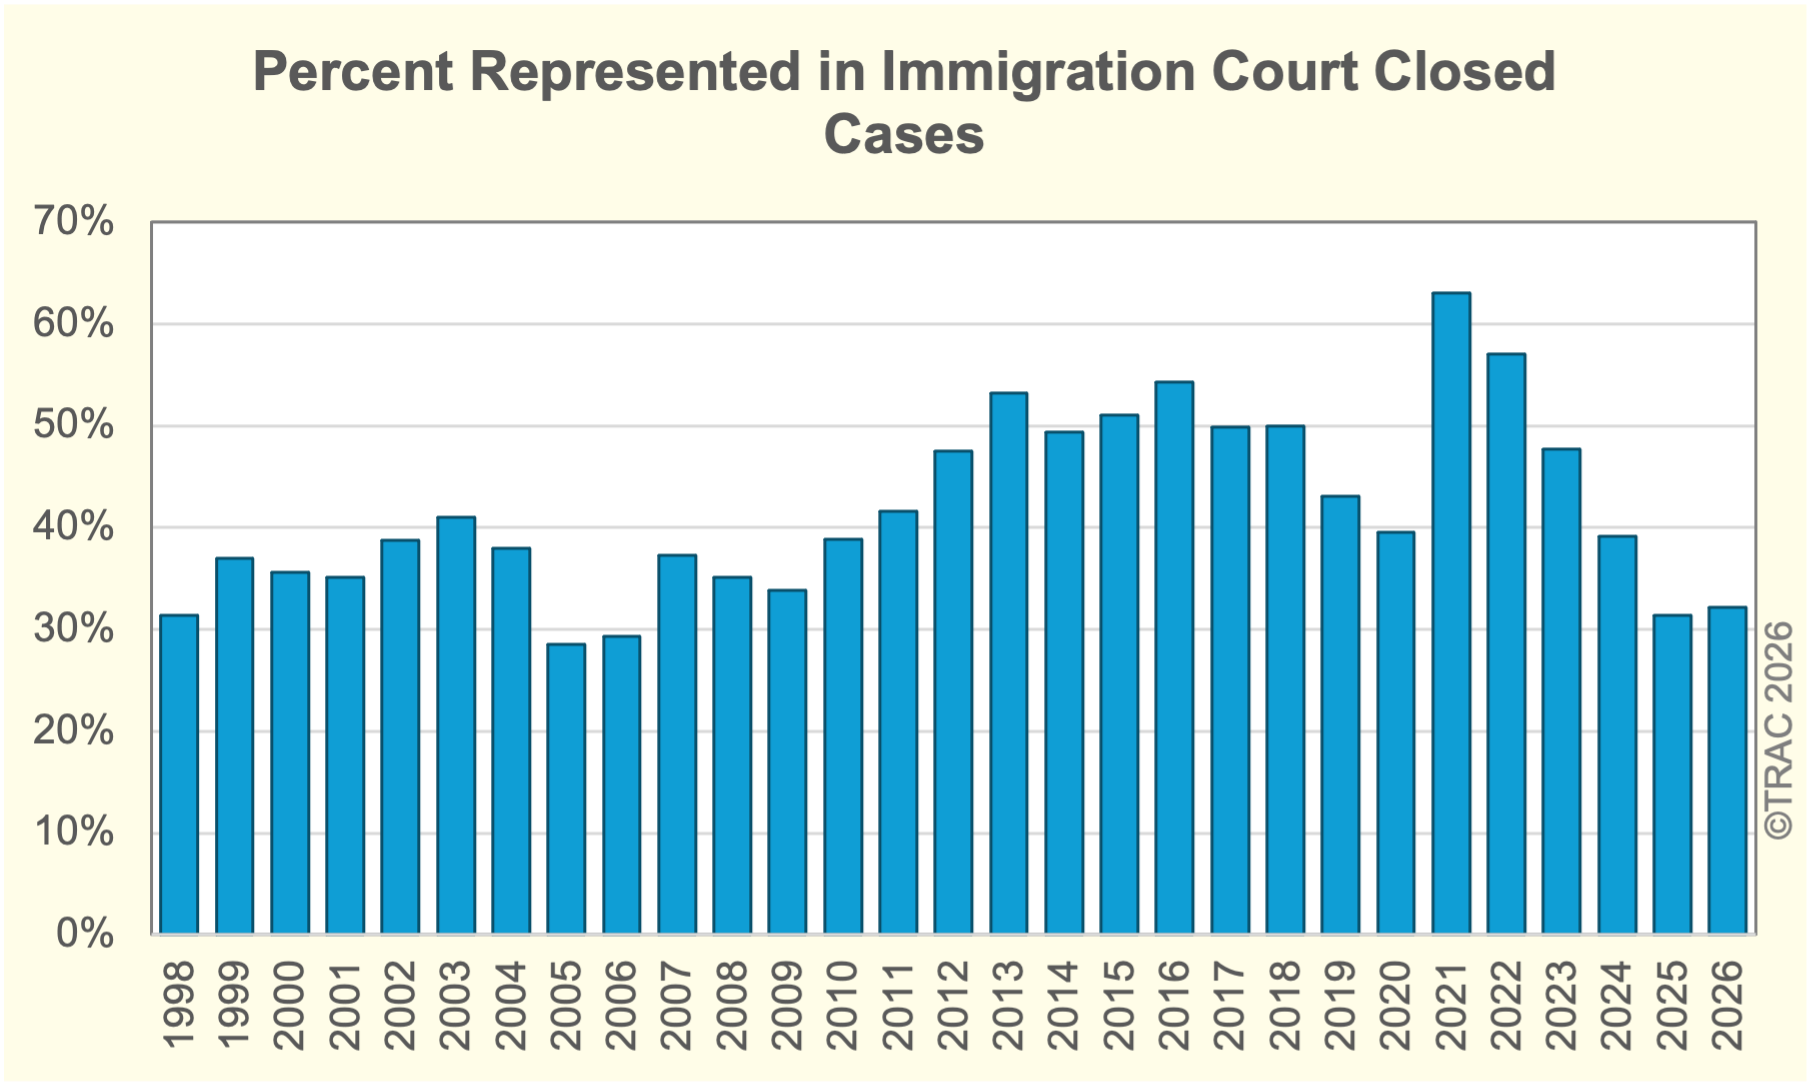
While the government is always represented in Court by an attorney, this is not true for the immigrant. Unlike in criminal proceedings, the federal government is not required to provide legal counsel to those without the means to hire an attorney. While many communities including law firms and clinics attempt to provide legal assistance on a pro bono basis, their numbers have been insufficient to meet the need. As a result, the overall odds of having representation in Immigration Court completed cases has dropped from 63 percent in FY 2021 to 32 percent in FY 2026. See Figure 1.
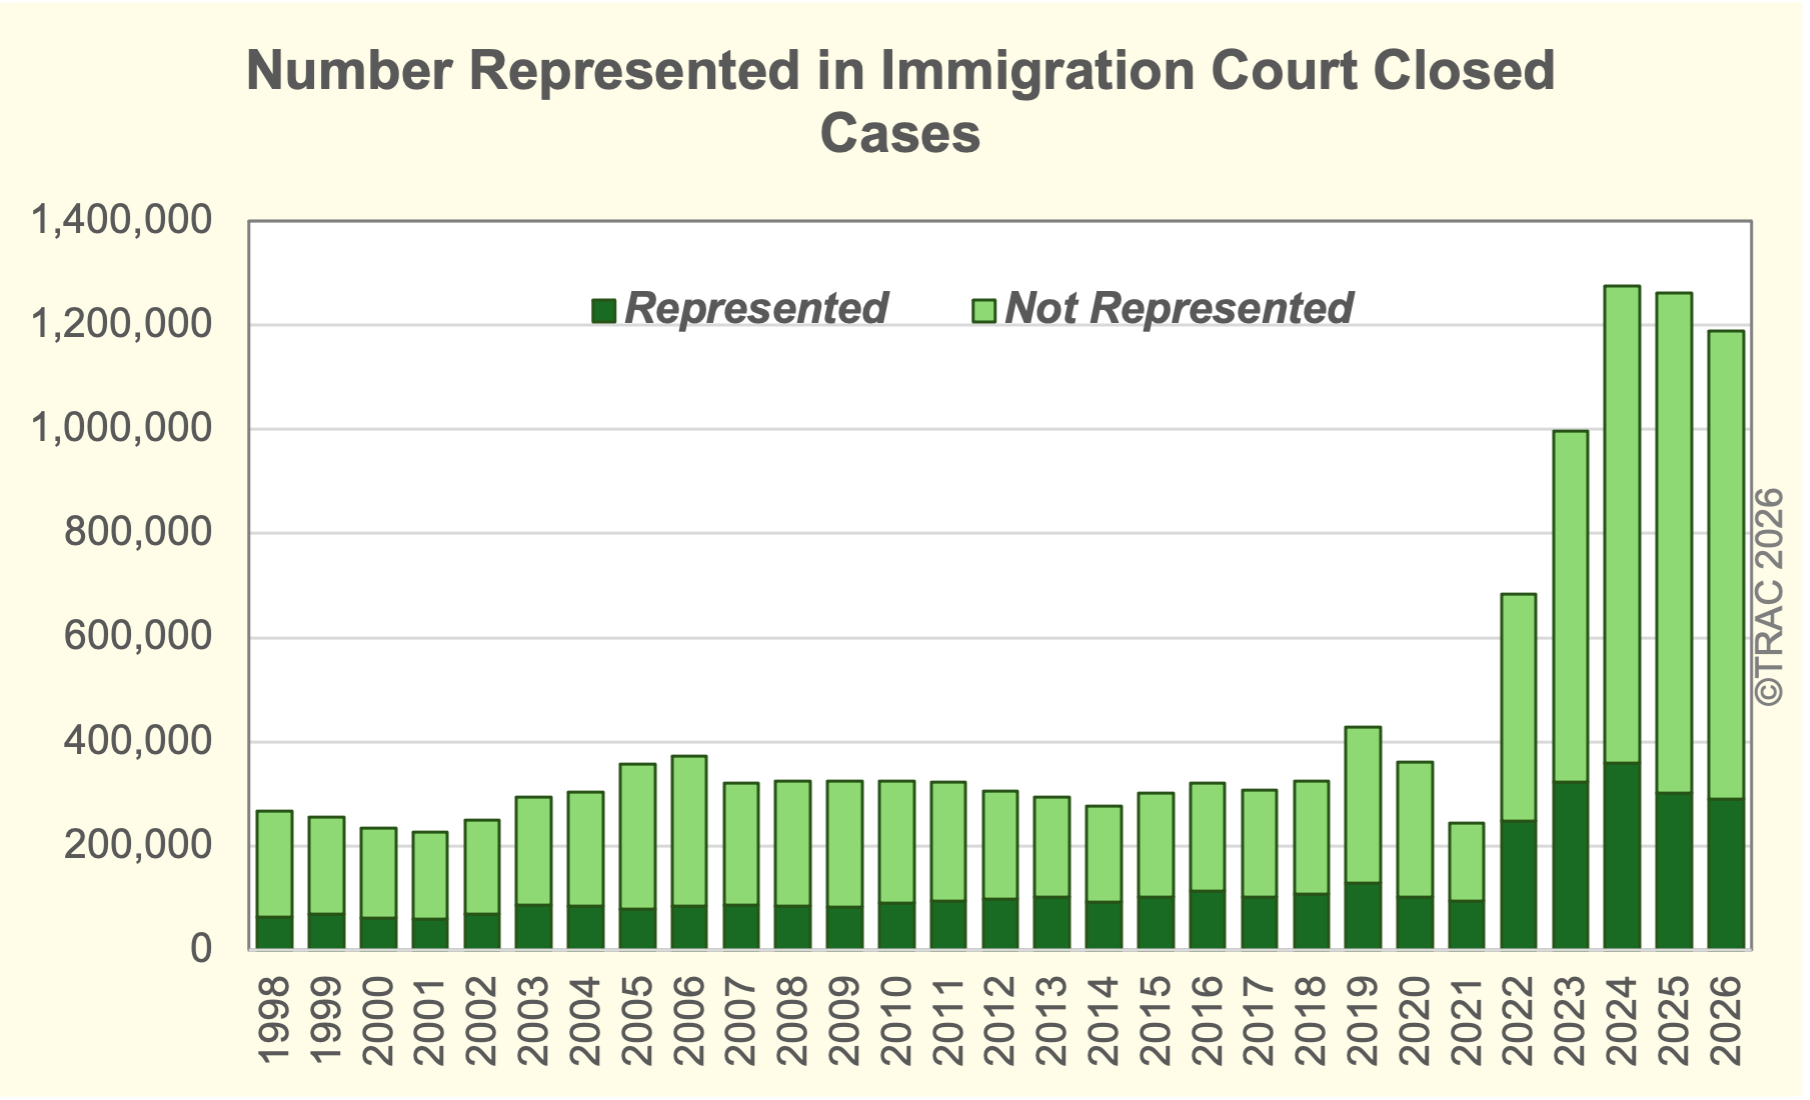
Efforts to expand the supply of immigration attorneys did increase their numbers so that the number of individuals with representation initially grew when the pace of case dispositions began growing after the end of the COVID-19 shutdown. This growth has been insufficient to meet the growing demand and availability has now declined. The actual number of represented individuals in Immigration Court peaked in FY 2024, while numbers with representation dropped in FY 2025 and FY 2026. See Figure 2.
Where You Live Impacts Ability To Obtain Representation
For new cases arriving at the Immigration Court in the last 90 days, seven out of ten (70.5%) new immigrants to Maine had already found representation. Maine tops the list of states with the highest representation rates for new Court cases. The governor’s office in Maine has made a concerted effort to assist new immigrants through its Office of New Americans to help address the state’s workforce needs.
Hawaii follows closely behind Maine also with seven out of ten (70.2%) residents receiving Notices to Appear (NTAs) in Immigrant Court in the last 90 days already finding representation. Hawaii has long ranked high on its representation record and was at the top in May 2017 when TRAC first began monthly tracking of representation figures by state, county and local communities within each county.
In third place was West Virginia (65.5%), followed by Maryland (59.1%), and Massachusetts (56.8%) with a number of other states close behind. See Table 1.
At the other extreme with the lowest proportion of its residents who had found representation after receiving NTAs in the last 90 days was New Jersey. Fewer than one out of five (18.2%) individuals residing in New Jersey had found representation. Other states with particularly low initial representation rates were Alaska (24.0%), Kentucky (24.3%), Arkansas (24.5%) and Illinois (25.6%).
Typically, representation rates do increase as immigrants have more time to locate representation.[1] Table 1 provides state-by-state statistics on representation rates for all pending cases compared with rates for NTAs filed in the last 90 days. More detailed figures are available on representation by county and community (county subdivision) within each state in TRAC’s Mapping Representation in Immigration Court tool.
| State | All Pending Cases | Pending Cases Filed in Last 90 Days | ||||
|---|---|---|---|---|---|---|
| Number | Represented | Percent Represented | Number | Represented | Percent Represented | |
| Alabama | 22,358 | 8,143 | 36.4 | 291 | 88 | 30.2 |
| Alaska | 714 | 406 | 56.9 | 25 | 6 | 24.0 |
| Arizona | 23,764 | 15,120 | 63.6 | 1,325 | 660 | 49.8 |
| Arkansas | 12,576 | 5,146 | 40.9 | 376 | 92 | 24.5 |
| California | 331,503 | 245,842 | 74.2 | 12,966 | 6,851 | 52.8 |
| Colorado | 71,696 | 18,510 | 25.8 | 1,364 | 506 | 37.1 |
| Connecticut | 35,763 | 16,466 | 46.0 | 1,059 | 355 | 33.5 |
| Delaware | 9,410 | 5,781 | 61.4 | 332 | 109 | 32.8 |
| District Of Columbia | 2,319 | 1,621 | 69.9 | 186 | 92 | 49.5 |
| Florida | 491,582 | 176,244 | 35.9 | 24,910 | 6,907 | 27.7 |
| Georgia | 99,568 | 36,282 | 36.4 | 3,768 | 1,202 | 31.9 |
| Hawaii | 1,426 | 1,238 | 86.8 | 47 | 33 | 70.2 |
| Idaho | 11,823 | 2,593 | 21.9 | 126 | 39 | 31.0 |
| Illinois | 153,660 | 58,187 | 37.9 | 4,197 | 1,073 | 25.6 |
| Indiana | 67,246 | 22,915 | 34.1 | 1,983 | 574 | 28.9 |
| Iowa | 18,372 | 9,000 | 49.0 | 291 | 147 | 50.5 |
| Kansas | 21,027 | 6,838 | 32.5 | 371 | 190 | 51.2 |
| Kentucky | 40,800 | 14,333 | 35.1 | 1,282 | 311 | 24.3 |
| Louisiana | 23,543 | 16,073 | 68.3 | 2,480 | 1,215 | 49.0 |
| Maine | 8,536 | 6,261 | 73.3 | 210 | 148 | 70.5 |
| Maryland | 38,644 | 28,317 | 73.3 | 3,121 | 1,843 | 59.1 |
| Massachusetts | 125,430 | 72,232 | 57.6 | 2,719 | 1,544 | 56.8 |
| Michigan | 29,691 | 12,996 | 43.8 | 1,015 | 512 | 50.4 |
| Minnesota | 28,153 | 20,178 | 71.7 | 594 | 315 | 53.0 |
| Mississippi | 8,216 | 5,032 | 61.2 | 958 | 455 | 47.5 |
| Missouri | 26,472 | 8,657 | 32.7 | 483 | 212 | 43.9 |
| Montana | 1,787 | 500 | 28.0 | 31 | 9 | 29.0 |
| Nebraska | 19,829 | 11,583 | 58.4 | 380 | 196 | 51.6 |
| Nevada | 20,559 | 12,566 | 61.1 | 1,268 | 704 | 55.5 |
| New Hampshire | 3,740 | 2,327 | 62.2 | 195 | 101 | 51.8 |
| New Jersey | 208,726 | 78,116 | 37.4 | 5,913 | 1,076 | 18.2 |
| New Mexico | 2,954 | 1,977 | 66.9 | 572 | 302 | 52.8 |
| New York | 302,266 | 230,025 | 76.1 | 11,292 | 4,091 | 36.2 |
| North Carolina | 74,469 | 23,644 | 31.8 | 2,057 | 560 | 27.2 |
| North Dakota | 2,155 | 1,185 | 55.0 | 90 | 50 | 55.6 |
| Ohio | 51,336 | 34,715 | 67.6 | 1,338 | 727 | 54.3 |
| Oklahoma | 18,075 | 4,974 | 27.5 | 1,161 | 431 | 37.1 |
| Oregon | 23,134 | 6,824 | 29.5 | 255 | 66 | 25.9 |
| Pennsylvania | 73,102 | 45,646 | 62.4 | 3,223 | 874 | 27.1 |
| Rhode Island | 10,959 | 7,003 | 63.9 | 344 | 178 | 51.7 |
| South Carolina | 40,686 | 13,407 | 33.0 | 723 | 225 | 31.1 |
| South Dakota | 2,670 | 1,882 | 70.5 | 61 | 32 | 52.5 |
| Tennessee | 61,604 | 24,676 | 40.1 | 1,459 | 440 | 30.2 |
| Texas | 264,595 | 101,121 | 38.2 | 17,252 | 7,850 | 45.5 |
| Utah | 43,201 | 18,051 | 41.8 | 749 | 199 | 26.6 |
| Vermont | 1,047 | 517 | 49.4 | 30 | 10 | 33.3 |
| Virginia | 33,575 | 25,439 | 75.8 | 3,228 | 1,588 | 49.2 |
| Washington | 47,542 | 24,932 | 52.4 | 1,242 | 573 | 46.1 |
| West Virginia | 857 | 615 | 71.8 | 55 | 36 | 65.5 |
| Wisconsin | 28,148 | 11,467 | 40.7 | 746 | 222 | 29.8 |
| Wyoming | 1,208 | 565 | 46.8 | 44 | 14 | 31.8 |