Immigration Removals Fall During the Second Trump Administration
Published Nov 11, 2026
Case-by-case records current through August 24, 2026, obtained by TRAC through successful litigation under the Freedom of Information Act (FOIA)[1] document that contrary to news reporting and public perception, the number of individuals removed from the United States actually declined after President Trump assumed office in January 2025.
These records are from the Department of Homeland Security’s Enforcement Integrated Database (EID) which Immigration and Customs Enforcement personnel manage. This is the official repository and most comprehensive source of immigration enforcement data covering not only actions by ICE, but also by Customs and Border Protection (CBP). Data are entered daily as events occur by CBP and ICE enforcement personnel. This integrated process helps prevent double counting when recording each encounter by ICE, border patrol agents and individuals found to be inadmissible by Office of Field Operations (OFO) port authorities. Data are structured to follow each noncitizen from the initiation of their case to final outcome, recording whether or not the individual was deported, allowed to remain in this country, or whether all charges were dropped. If the case is still ongoing, the current status is shown. Records cover the period from 2008 to the present, with some individuals’ immigration histories going back to the 1920s or earlier.[2]
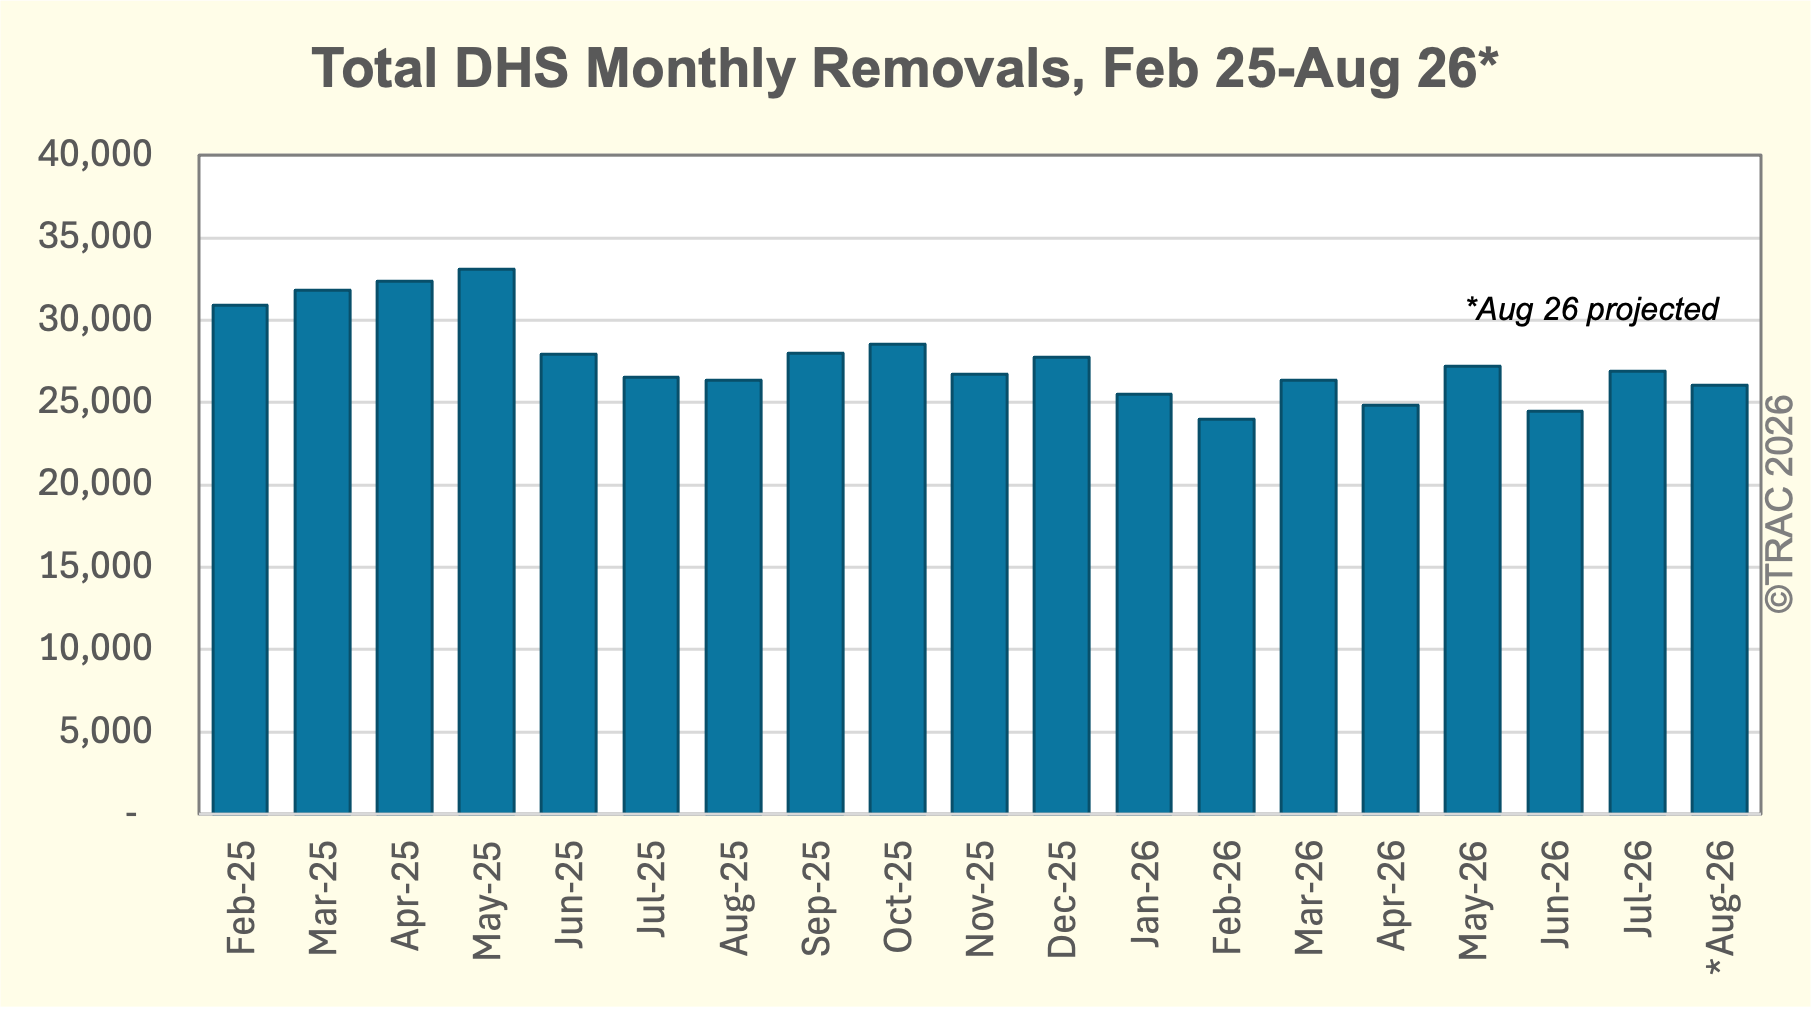
Despite the reassignment of personnel from other agencies to immigration enforcement, the passage of the One Big Beautiful Bill Act (OBBA) and with it, a substantial increase in resources for immigration enforcement activities, the number of immigration removals conducted by DHS has actually declined. Figure 1 depicts removals month-by-month during this period based on the date each of these individuals was deported. As Figure 1 shows, initially removals began to rise, but numbers then fell in June 2025 and during 2026 largely plateaued.
During the first full month of Trump’s second term, for example, a total of 39,893 removals were recorded by the agency.[3] During July 2026, the last full month for which data are available, the number declined to 26,908 – a drop of 13 percent. If we extend the comparison through the first 24 days of August 2026, total removals projected for all of August would be 26,383[4] — an effective drop of 15 percent.
Trump’s Record on Removals Lag Behind Prior Administrations
Contrary to public perceptions of lax immigration enforcement during prior administrations, the Trump administration’s record over the last 12 months has lagged behind a number of past administrations. Analysis of these recently released case-by-case records systematically tracking all individuals DHS has sought to remove since 2008 documents that the greatest number of removals occurred in FY 2024, the final full fiscal year of the Biden administration.
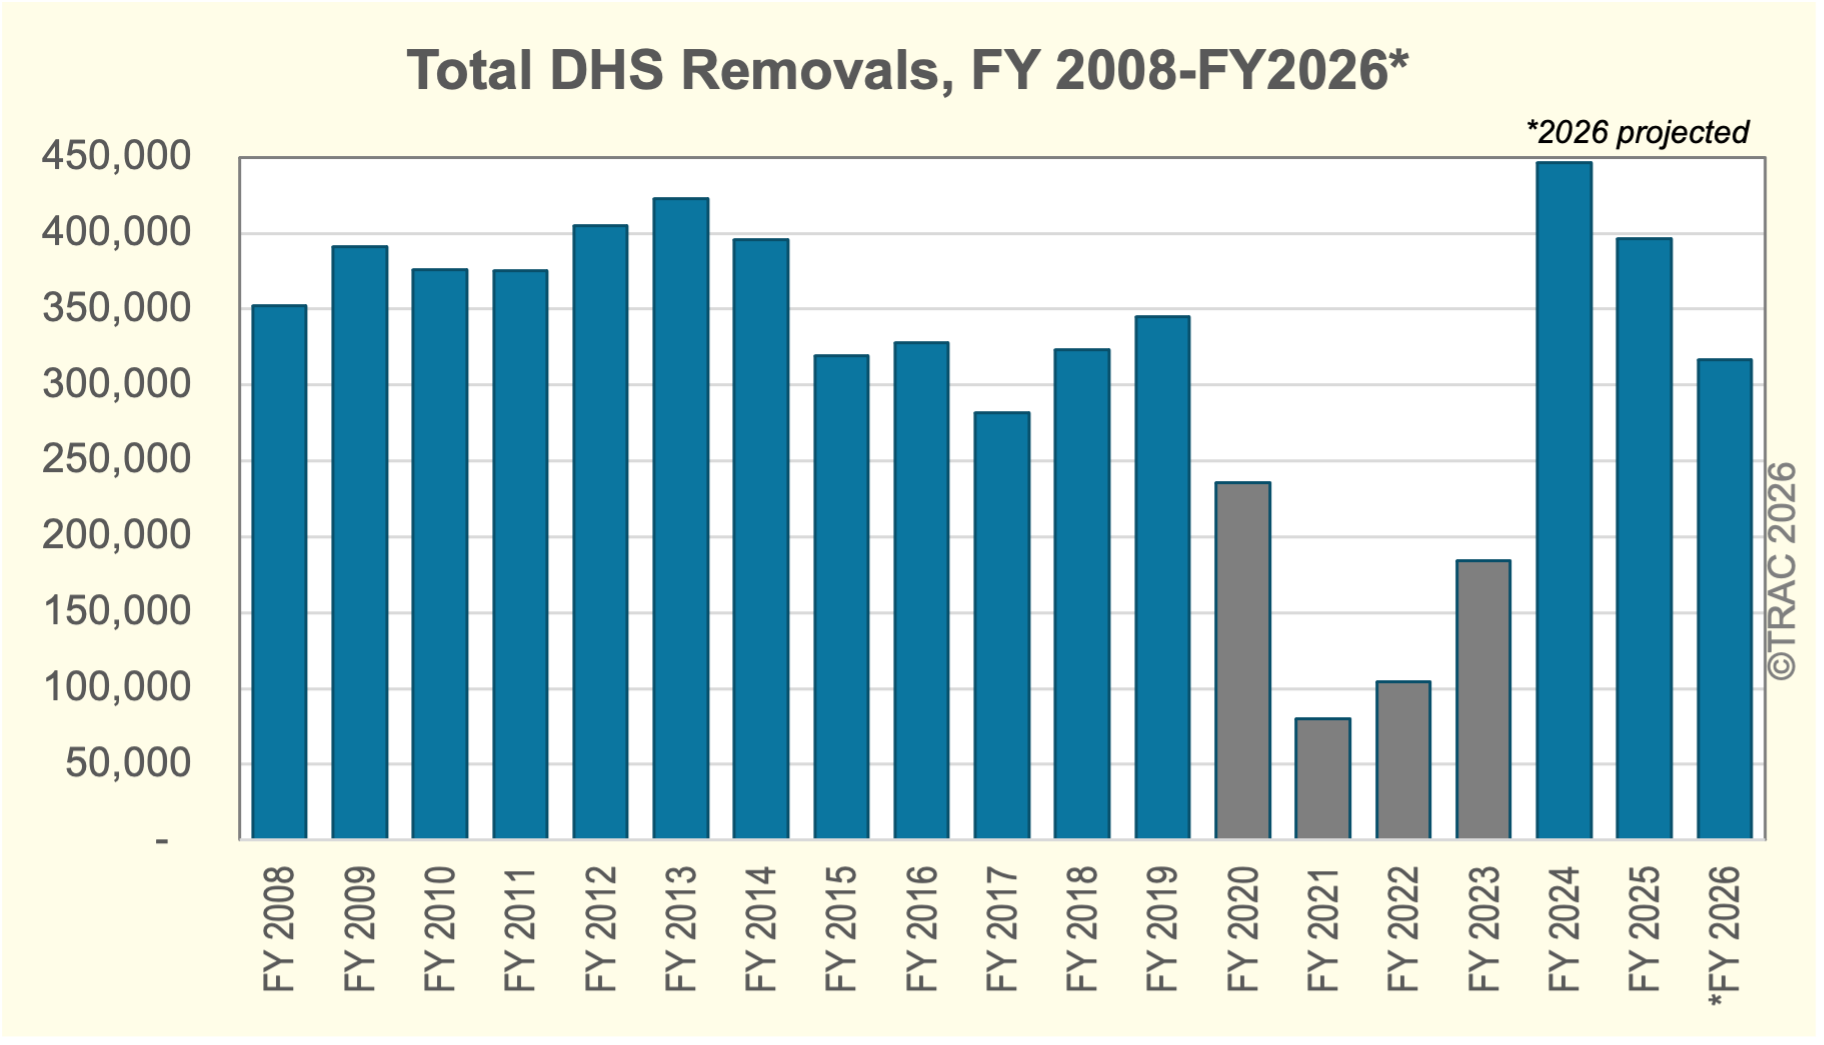
A record number of 446,180 individuals were recorded as removed in FY 2024.[5] Whether one compares this with the projected number of removals for all of FY 2026 of 316,312,[6] or for the last 12 months for which full data are now available (August 2025-July 2026) where removals totaled 316,601, the number of removals are down by about 29 percent since Biden’s last full year in office.
Figure 2 shows year-by-year the number of removals over the past two decades. The number of removals during the last 12 months under President Trump is less than in any fiscal year from FY 2008 to FY 2016 during the George W. Bush’s and Barack Obama’s administrations. Notably, the last low point in the total number of removals excluding the COVID period (fiscal years 2020-2023[7] ), was in FY 2017 during the initial year of the first Trump administration when 281,575 removals were recorded as completed.
Voluntary Departures and Returns
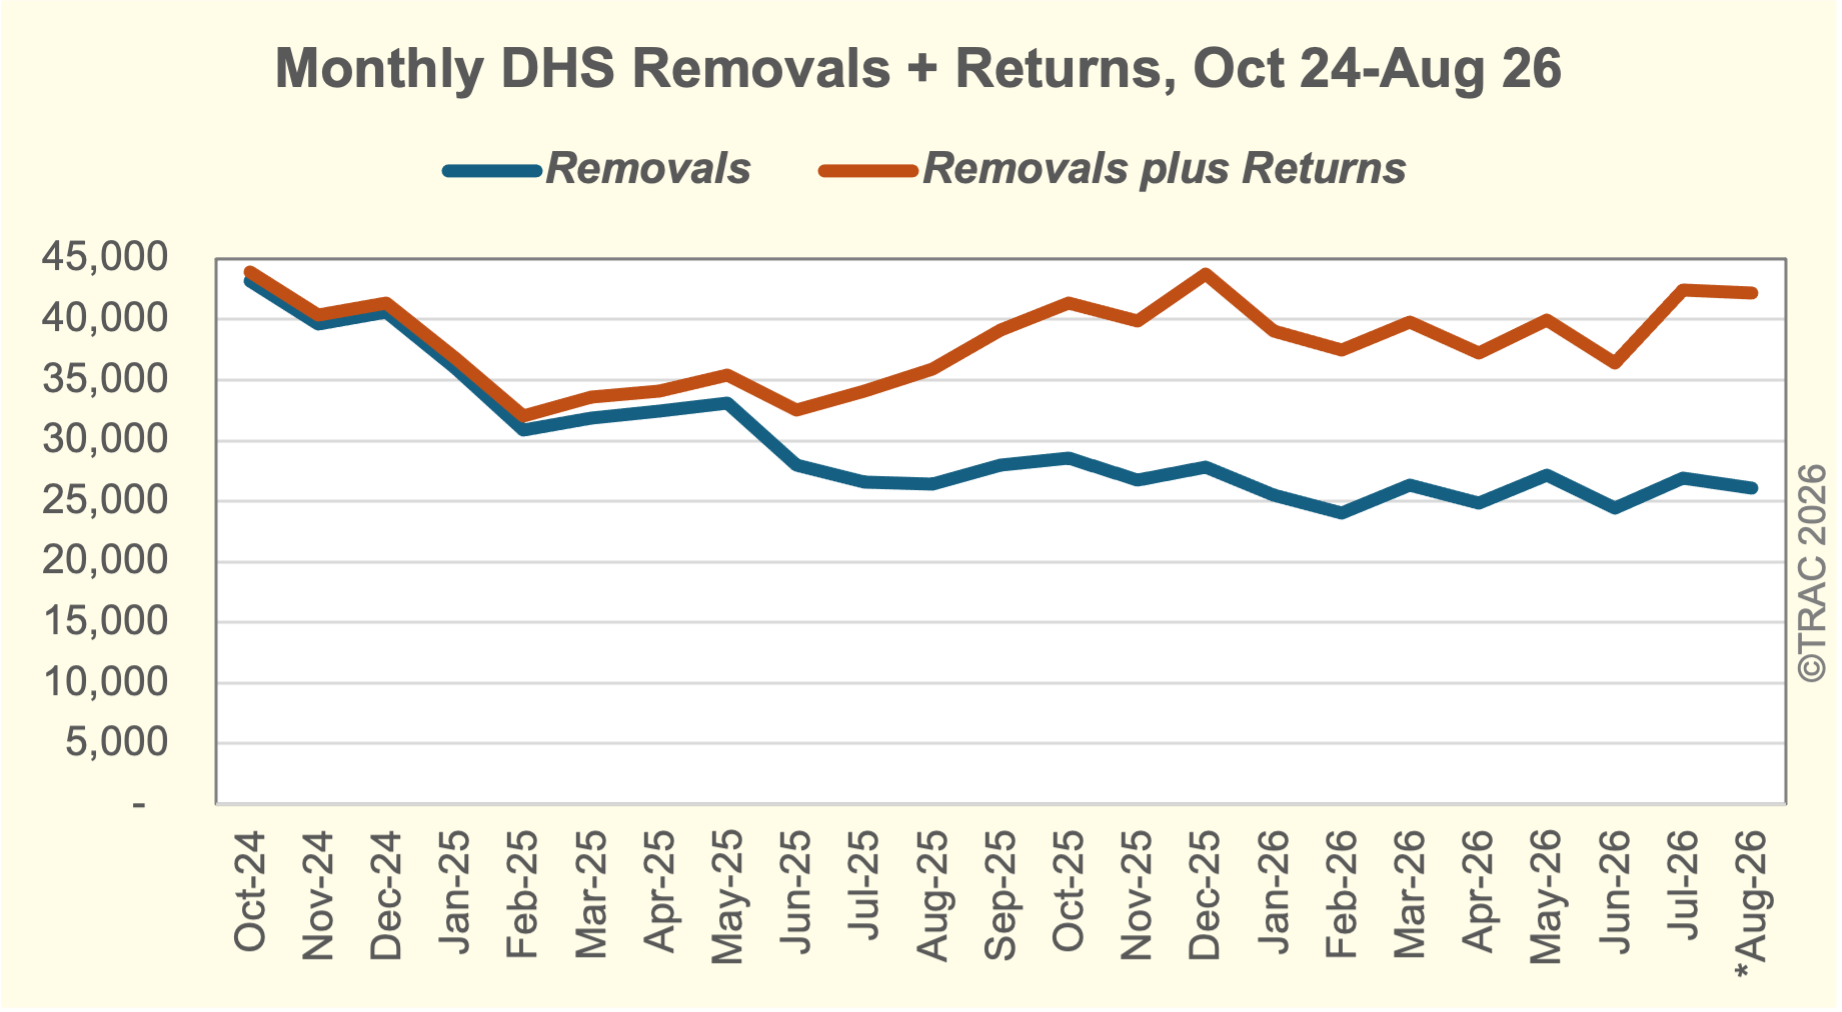
When ICE speaks about removals, in the fine print they usually include removals plus returns. Removals bar an individual from legally returning to the United States for a period of years. For returns, reentry is not legally barred. This broader measure (“deportations”) includes voluntary departures and voluntary returns along with removals.[8] Figure 3 shows month-by-month figures for both the number of removals (dark blue color line) and the higher figures for removals and returns (dark orange color line).
In July 2026, for example, the number of deportations reached 42,399 far above actual removals of 26,908. Removals made up only 63 percent of total deportations in both July and August 2026. Voluntary departures had risen to 31 percent, while voluntary returns made up the remaining 6 percent.[9] This compares with the first three months of the Trump administration when voluntary departures and returns made up less than 5 percent and removals made up close to 95 percent of all deportations.
The largest change occurred for voluntary departures. Voluntary departures ordered by Immigration Judges (IJs) soared during FY 2026. IJs handed down more than a hundred thousand of these orders, up from just nine thousand 9,000 during FY 2024. A noncitizen must leave following such orders but may be given a period of time to put their affairs in order before they are required to depart. During FY 2024, 5,400 departed following such orders. During FY 2026, the number of individuals leaving this country reached an estimated 134,000. — an increase of over 2,000 percent compared with FY 2024.
The rise in this number is likely attributable to a number of factors including the sharp rise in asylum denials, increased exigency with which removal proceedings are being conducted and the denial of bond for detained foreign nationals. EOIR initiatives such as “mega master” hearings and the inability of foreign nationals to obtain a bond, a financial commitment that allows the foreign national to remain out of immigration detention during the pendency of their immigration removal proceedings, have all incentivized foreign nationals in immigration proceedings to consent to their deportation.[10]
The increase in voluntary returns may also reflect the use of a “stipulation” that waives an Immigration Court hearing and agrees to deportation, which ICE began using in the spring of 2025.[11] Monthly voluntary returns grew from around 400 in the early Trump months to 1,000s and peaking at just under 5,000 in December 2025 before settling down to an average closer to several thousand per month in 2026. Similar to voluntary departure, persons may be incentivized to sign a stipulation because they are detained and are seeking to be released rather than await what is often a lengthy process to apply for and obtain an Immigration Judge’s decision on an application for relief in Immigration Court.
Deportation Records Across The Decades
Despite a government-wide investment of enormous resources and soaring detention numbers, this administration’s mass deportation efforts have not begun to measure up to either the administration’s goals or its rhetoric. Even with voluntary departures and voluntary returns added to traditional removals, these EID records document that deportations are not as high or are about the same as the number of deportations twenty years ago.
Figure 4 shows year-by-year deportation numbers from FY 2008 to FY 2026. Removals, voluntary departures, and voluntary returns are separately shaded. Documented deportations during the last two decades peaked at 489,251 in FY 2009 under former President Obama compared with a projected total of 481,008 for FY 2026. They were also about the same under the final year of President Bush’s administration in 2008.
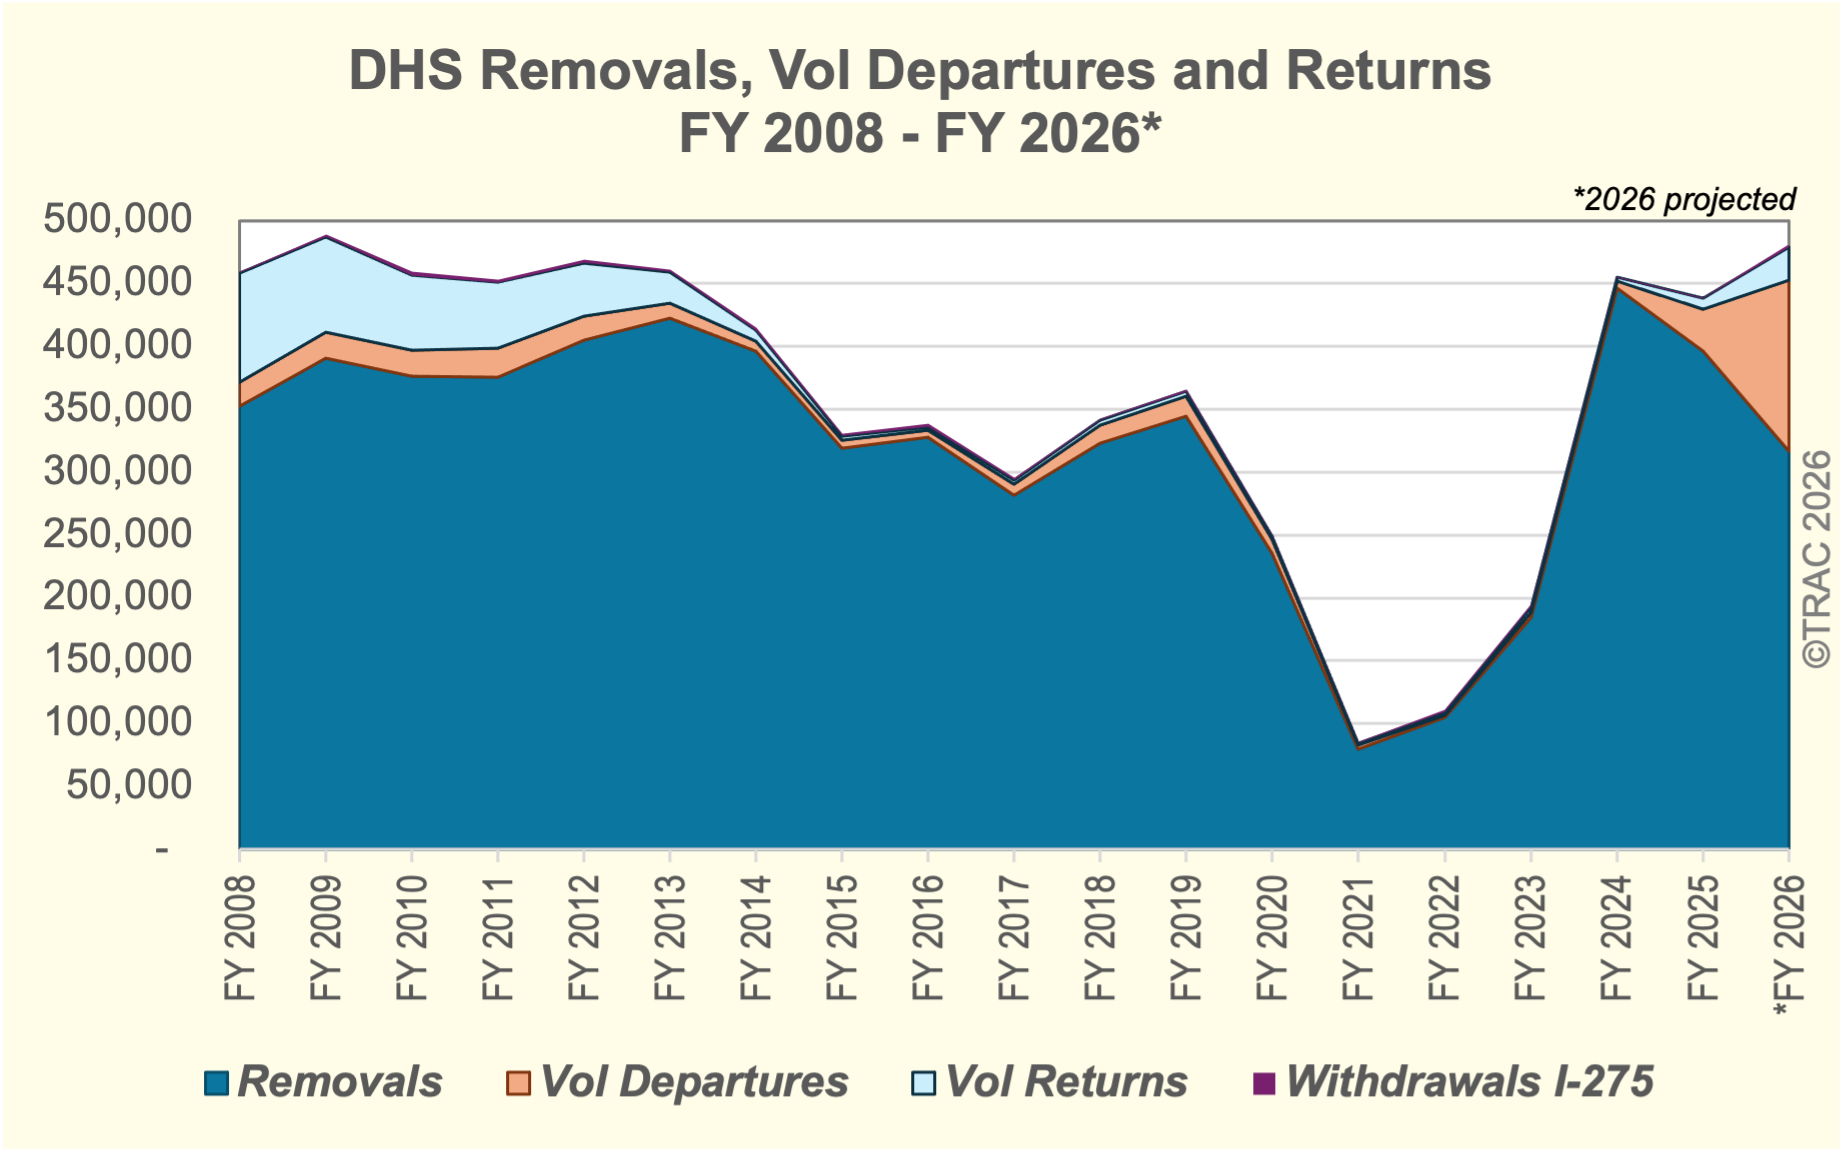
The composition of deportations in FY 2026 has changed significantly from earlier years. Removals as discussed earlier are much lower. While the combined total of voluntary departures, voluntary returns, and withdrawals rose to approximately 164,693 in FY 2026, this total is heavily skewed by a surge in voluntary departures, which represented approximately 28% of all deportations in FY 2026. Comparatively, voluntary returns accounted for just 5.3% of deportations in FY 2026. This trend is a reversal of the FY 2008 to FY 2012 period when the total number of voluntary returns was between 42,000 and 87,000 per year.
Future Releases
As a result of TRAC’s court victory, ICE has agreed to release potentially hundreds of additional fields of information. Only an initial release has occurred. And for this report, we analyze only removals and returns recorded in these new data.
These releases we hope will allow a fuller assessment of the entire immigration and enforcement histories of 19.9 million individuals whom the federal government has targeted since 2008 with the aim of deporting them from this country. Day-by-day, month-by-month and year-by-year, just how many individuals have and are being targeted? How frequently have federal immigration efforts resulted in the removal or return of these targeted individuals? How often have government officials dropped their charges, or has the individual been found to have a legal right to remain in the country? How long have cases taken and has this time gotten shorter or longer under different presidential administrations? And of course, how has the composition of individuals who were targeted changed over the years, and how has that affected outcomes?
More data releases are scheduled for the coming months, and more reports are planned after data are received, checked and validated.
Also included for DHS are withdrawals of applications for admission (accompanied by an I-215) of individuals arriving at a U.S. port of entry and voluntarily withdrawing their request to enter the United States. These have usually varied between a thousand and two thousand each year. The peak number was 2,671 in FY 2010. In FY 2026 through August 24, a total of 2,079 have been recorded. All I-215 withdrawals are included in TRAC’s deportation figures in this report.